
At EWF, we believe the market works as a whole. Every instrument, symbol, or ETF is therefore related. Many traders do not track as many markets as we do, but through analyzing hundreds of charts every day, we can see a clear relationship between these different instrument. This time, we will take a look at EME, which was created back in 1988. Constructed according to the MSCI Global Investable Market Indexes (GIMI) Methodology, the MSCI EM Index is designed to dynamically reflect the evolution of the emerging markets opportunity set and to help investors meet global and regional asset allocation needs.
The Index, just like every risk asset, formed a low back in 03.23.2020. Since then it has traded higher in an impulse sequence. The market always advances in either a sequence of 5-9-13-17-21-25 when the sequences is an impulse. Alternatively, it advances in 3-7-11-15-19-23-27 when the sequence is corrective. The chart below shows an an impulsive sequence, which is a clear definition of five waves. Each subdivision in this case comes in five waves.
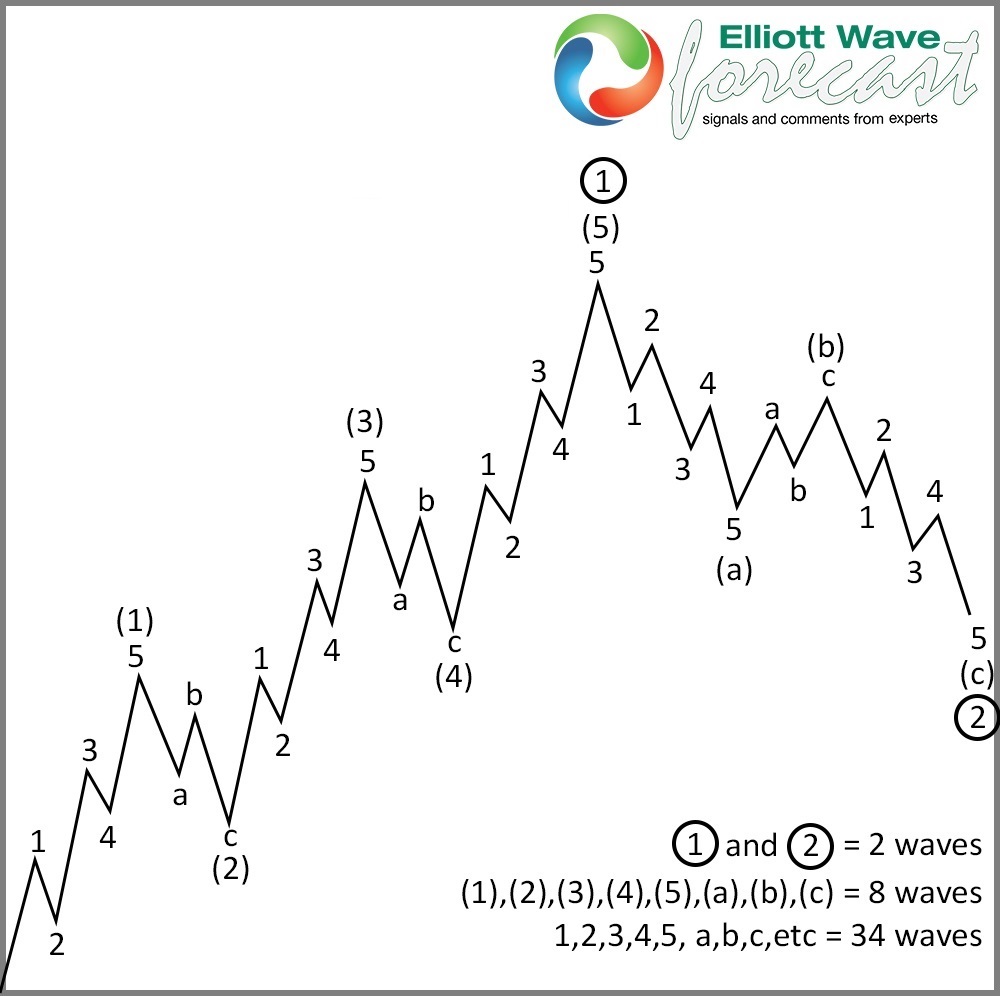
This idea represents the basis of the Elliott Wave Theory. The key is understanding the sequence, the stage, and what to expect next. Every time we see a possible five waves advance with a momentum divergence, we can expect a three waves pullback. A momentum divergence in three degrees should happen. First is the divergence between wave ((iii)) of 3 and wave ((v)) of 3. Second is the divergence wave 3 of (5) and wave 5 of (5). Last is the divergence between wave (3) and (5). If these conditions are present, the pullback is imminent and traders need to be aware that chasing the advance is risky.
EME 720 Minutes Elliott Wave Chart
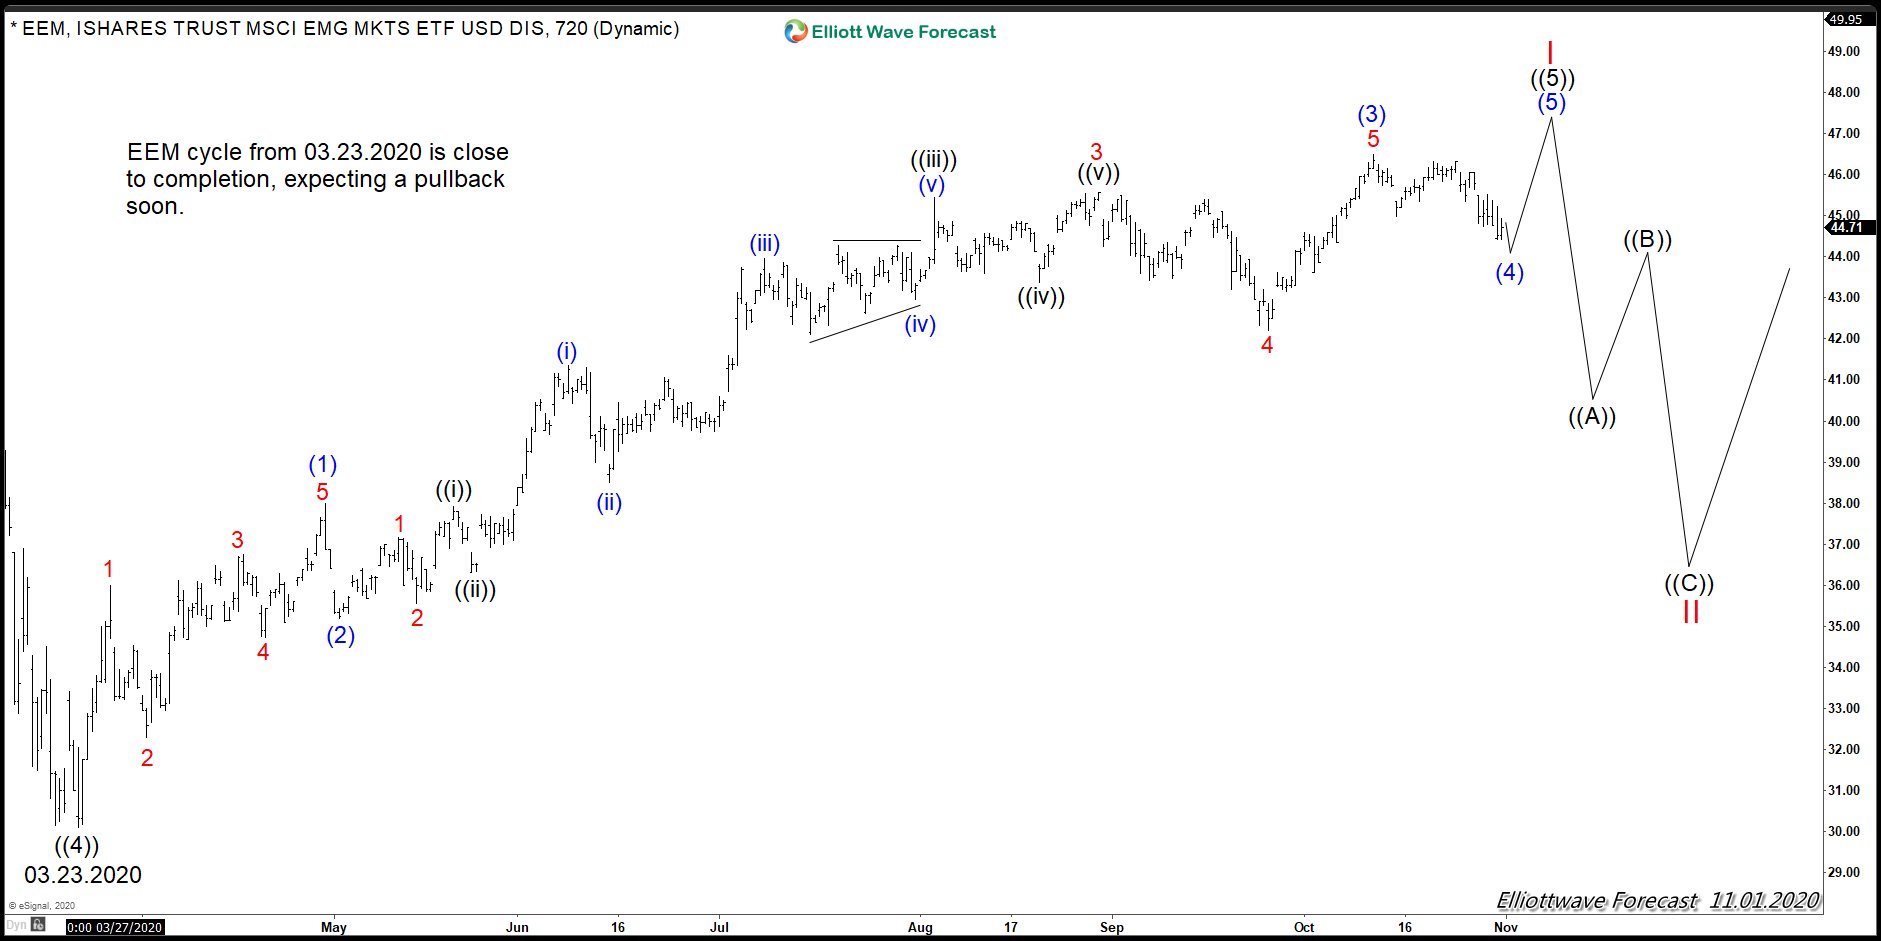
The chart above shows the advance since the lows at 03.23.2020 for EME. There’s a very clear subdivision of five waves since the lows. Although we believe a new high still can happen, we can already see a divergence, thus the cycle is mature. Chasing the move higher at this stage will need to be with a very well defined risk level. From the chart above, we believe that no matter what the result of the US General Election is, there won’t be a big rally into a wave III yet.
Correlation Between EEM and SPY
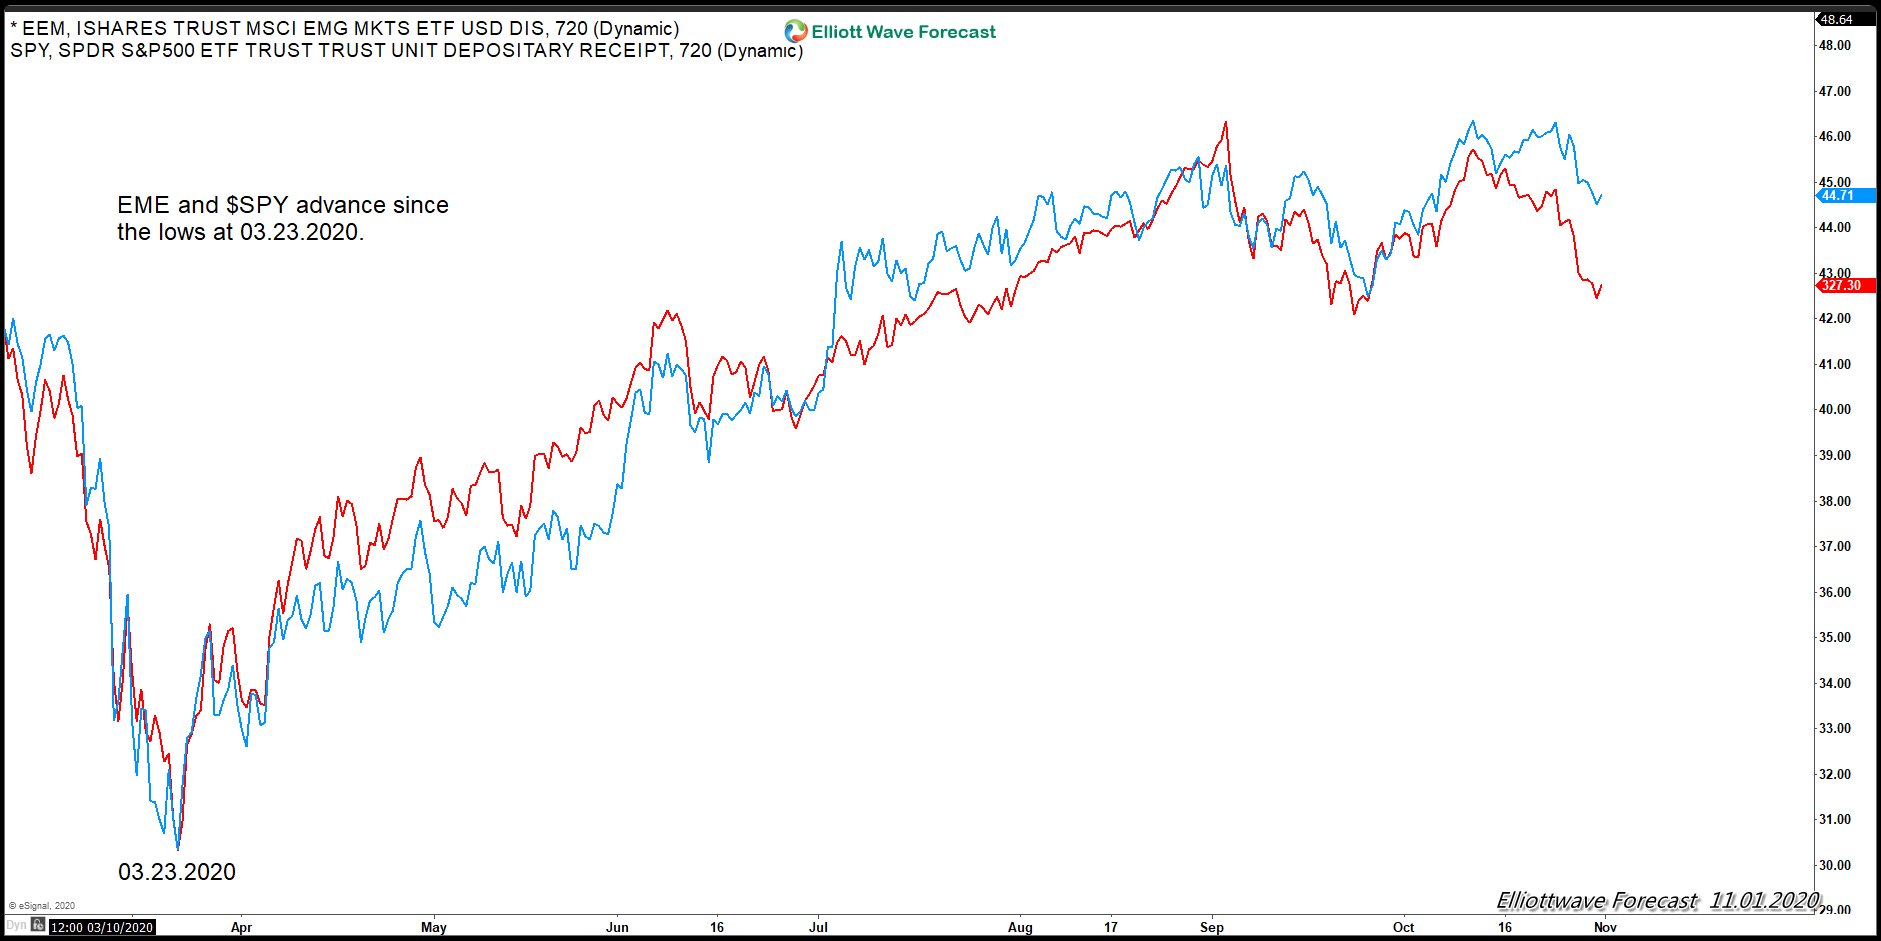
The chart above is an overlay chart of the EME and SPY, which shows an identical trade and also the relationship between the two markets. As we always say, It’s useful to know where every market is. This time around the warning is there, so let’s be careful.