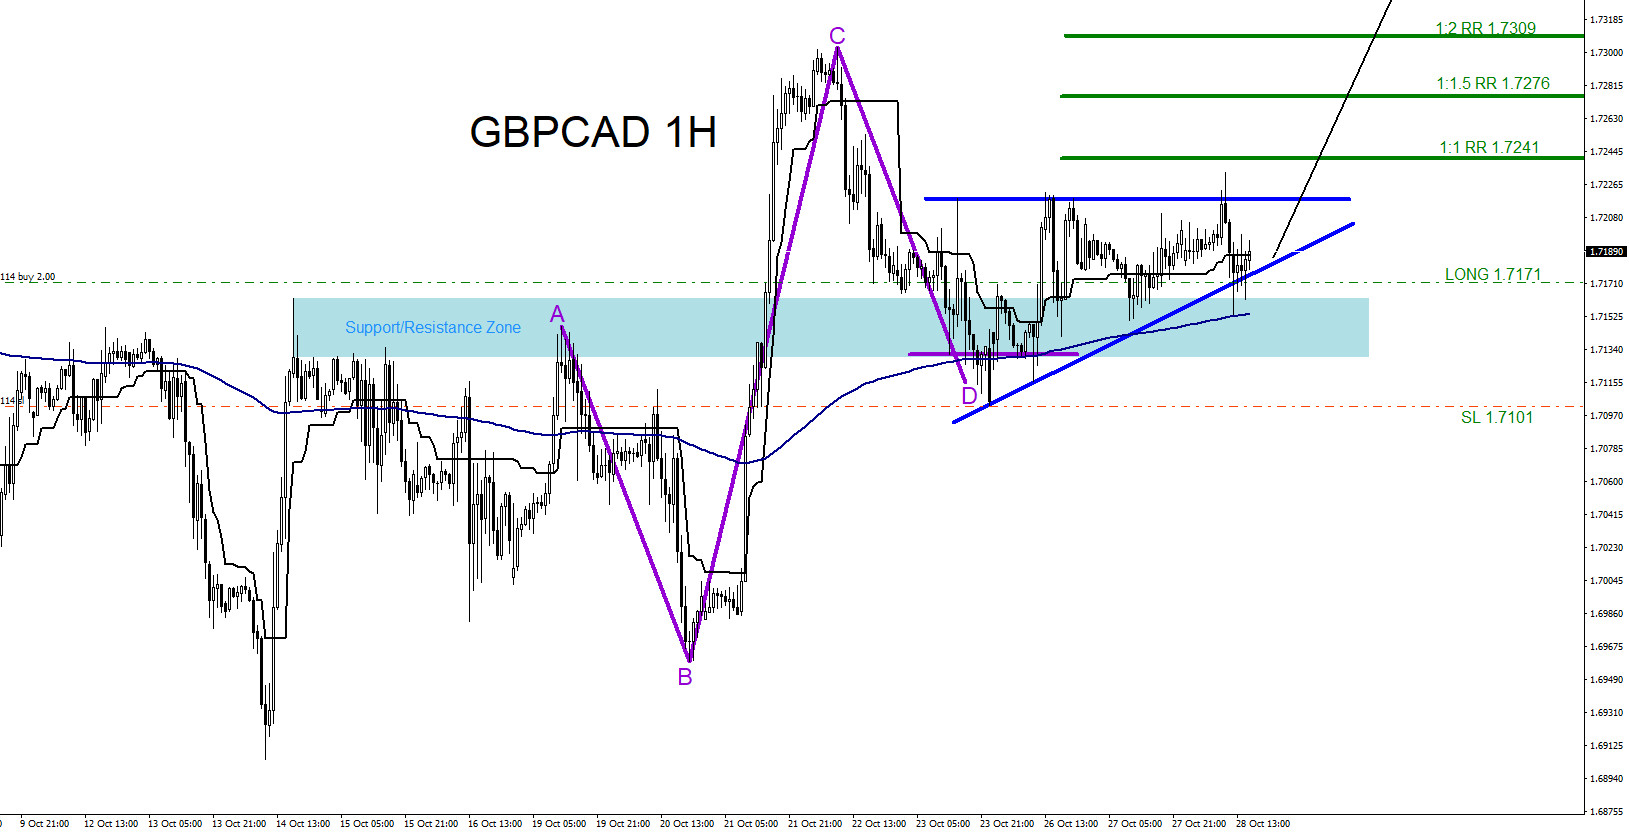
On October 27 2020 I posted on social media Stocktwits/Twitter @AidanFX “GBPCAD Watch for a move higher. Will be watching for possible buying opportunities.” The chart below shows bullish market patterns were visible and were calling for a move higher. Bullish Pattern (purple) triggered BUYERS at the BC 0.50% Fib. retracement level where the point D of the pattern terminated. The purple bullish pattern also terminated at a key support/resistance zone (light blue) where price reacted with push higher. Price was also respecting and staying above the 200 moving average (dark blue) which was another signal the pair could push higher. Also a bullish ascending triangle breakout pattern (blue) was forming and a break above the triangle would send GBPCAD higher and hit targets above it. These visible bullish patterns and signals allowed me to call the move higher and advise traders to look for buying opportunities.
GBPCAD 1 Hour Chart October 28 2020
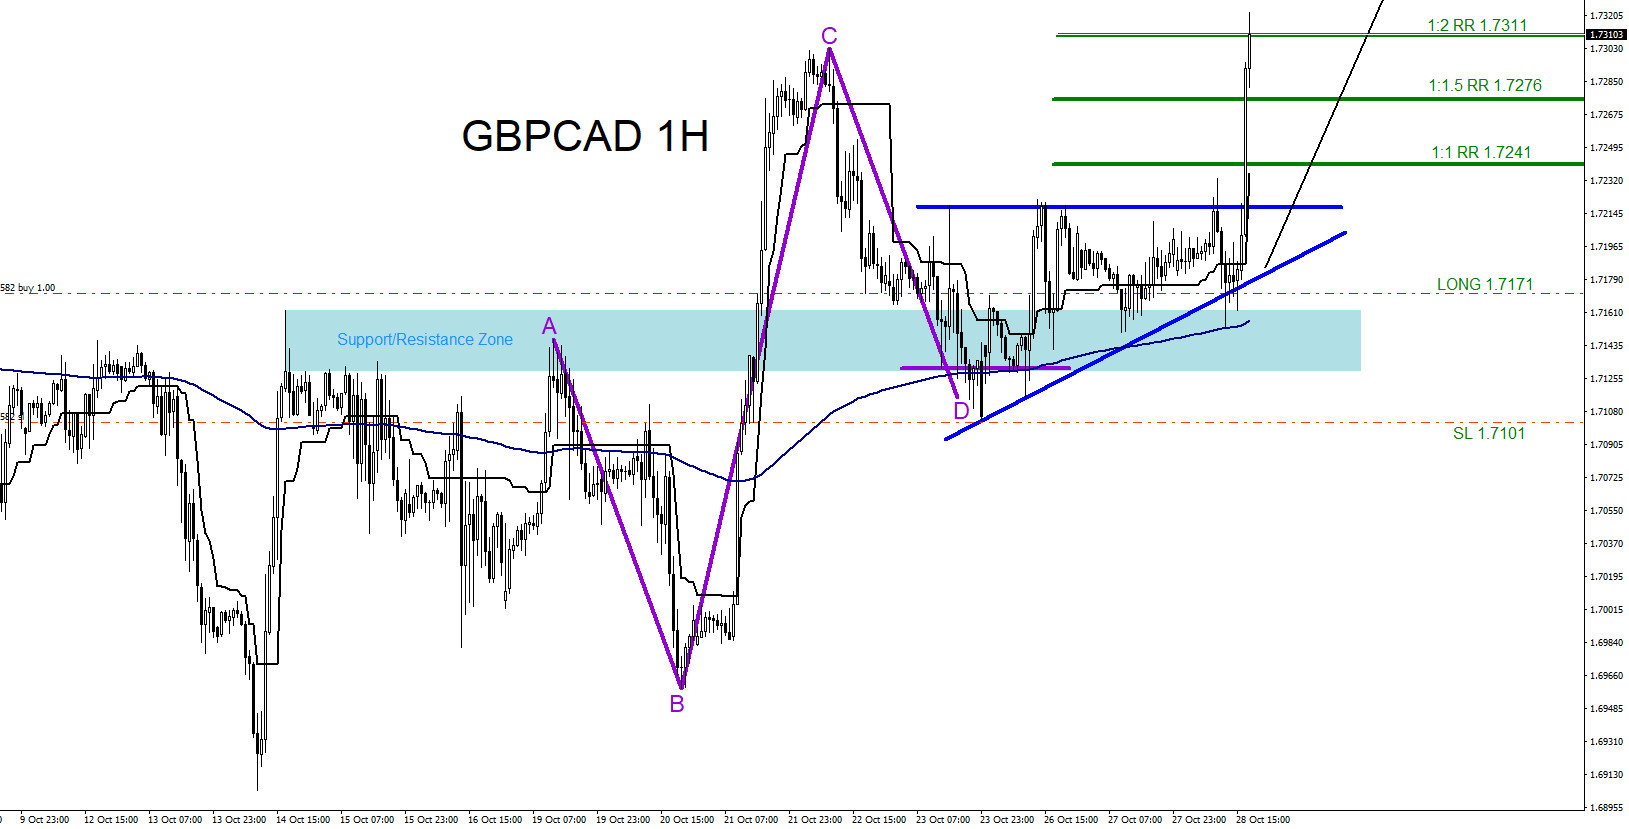
GBPCAD broke above the blue triangle which caused more buyers to get in the market and pushed the pair higher eventually hitting the 1:2 RR BUY target at 1.7311 from my 1.7171 buy entry for +140 pips. A trader should always use multiple trading strategies to confirm the trade and never trade off one simple strategy. If you followed me on Twitter/Stocktwits @AidanFX you too could have caught the GBPCAD move higher.
Of course, like any strategy/technique, there will be times when the strategy/technique fails so proper money/risk management should always be used on every trade. Hope you enjoyed this article and follow me on Twitter for updates and questions> @AidanFX