
IBM has been trading within a corrective sequence lower since the peak on 03.11.2013. The decline is a clear 3-7-11 sequence, which comes with a lot of overlapping and choppy price action. We do believe a double correction (WXY) is taking place. This is a combination of either two Zig Zags or two WXY which at the end reaches 100% between the first leg related to the second leg. The following chart illustrates this structure:
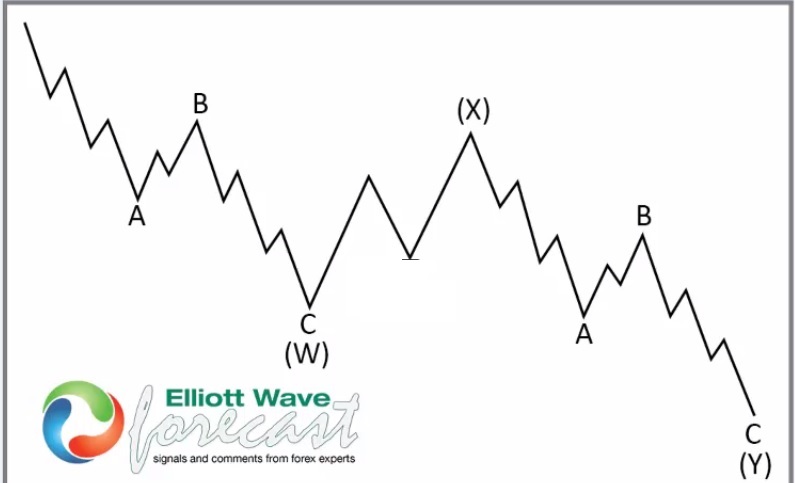
The same structure happens in IBM chart below.
IBM Weekly Elliott Wave Chart
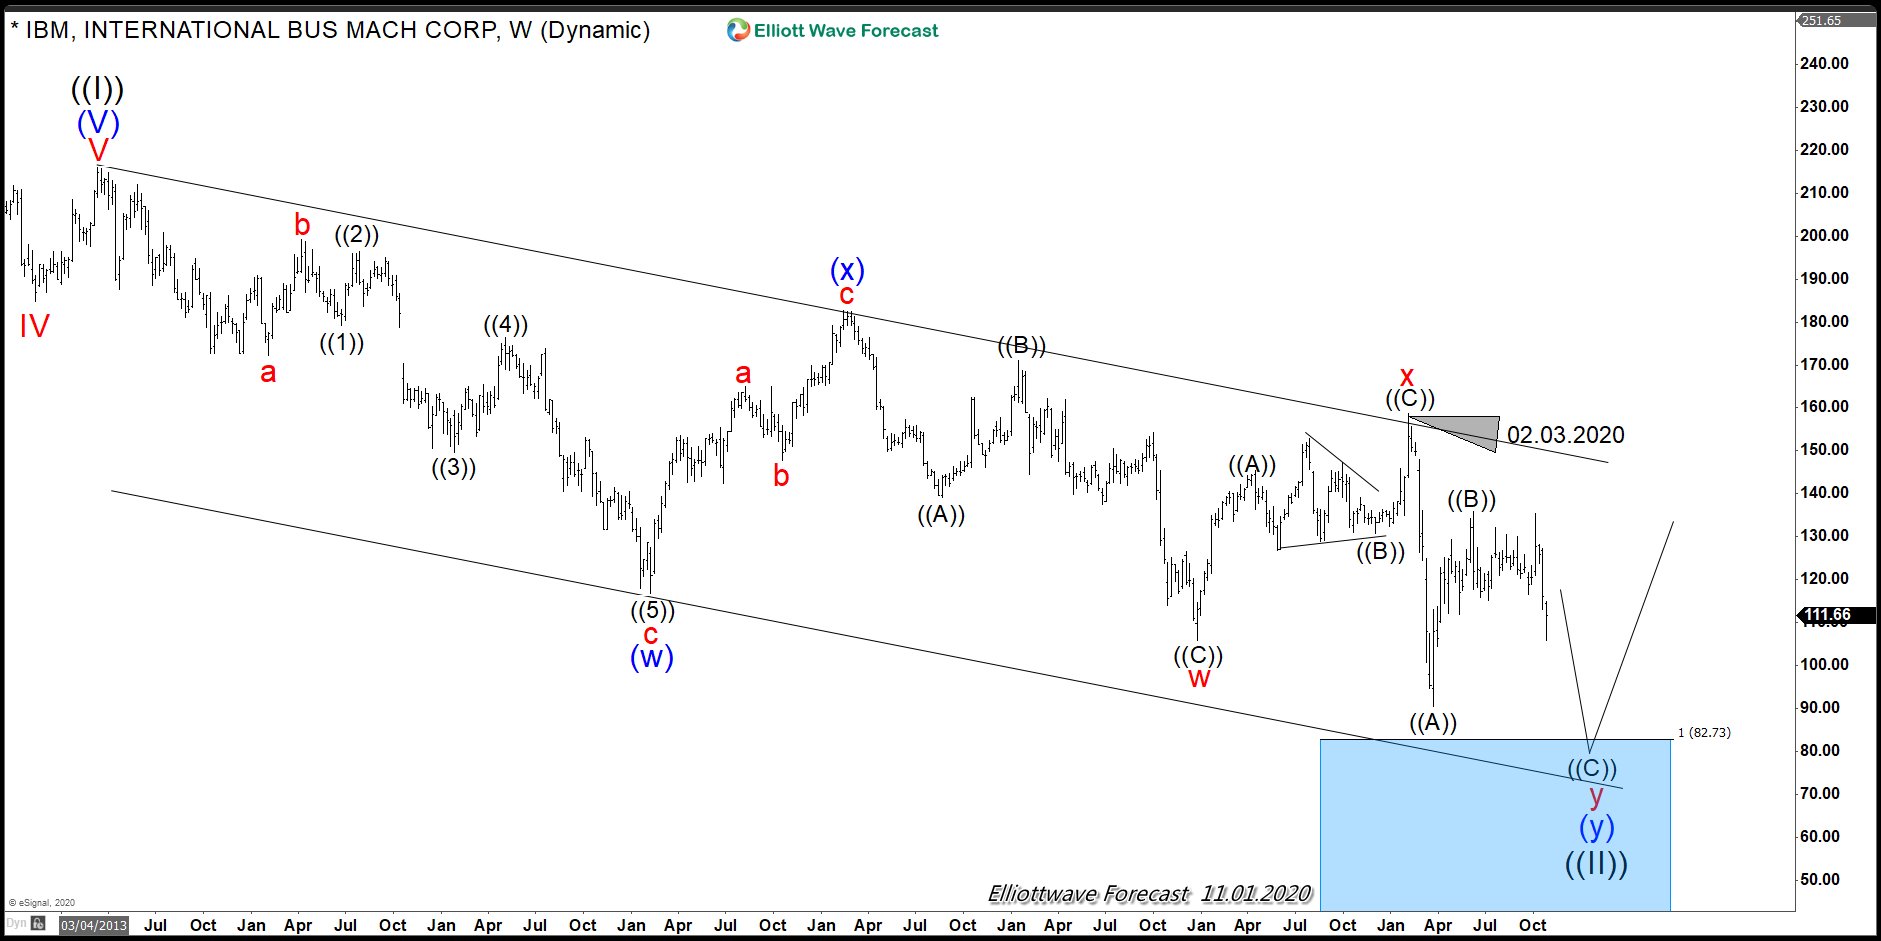
As we can see in the chart above, there is overlapping due to the fact that buyers understand the main trend in the higher degree cycles and enter the market. Sellers however see the multi-year decline and keep entering the short side. The WXY structure is very popular across the Market. When the structure is well defined, it becomes very easy to trade because the invalidations level is clear.
IBM chart above shows an overlapping decline from the peak at 03.11.2013. We did this article on IBM as long term investment opportunity \ back on 04.2020. At that time, we knew a bounce was coming. However, we also understand that the bounce will fail and sellers will have another chance to make the final push lower into the target. The idea is that every instrument is related. In the same way, IBM and World Indices also correlate even if they don’t necessarily trade in the same degree. World Indices can trade in first and second-degree correlation with IBM, but world indices will not be able to start a huge wave III advance until this bearish cycle in IBM ends.
As we have been saying, we relate all instrument and we understand the sequence and invalidation levels.
IBM Daily Elliott Wave Chart

The chart above represents the short term structure and the most bearish path. It also shows the path which will will be defined in the next few weeks of trading. Right now the key is to identify the latest push lower by the sellers and understand what that means. Relating the higher degree decline since the peak at 03.11.2013 with the peak at 06.08.2020, we can draw a conclusion that as far as the short term peak at 06.08.2020 remains intact, the last swing lower might have started. That means World Indices should be close to turning lower into the biggest decline since 03.23.2020 low. Alternatively, if IBM breaks above the peak at 06.08.2020, Indices can create another extension higher before another pullback. There will not be acceleration higher in World Indices until IBM ends the cycle since the peak on 03.11.2013.