Micron Technology (MU) leads the memory and storage industry with advanced DRAM, NAND, and emerging memory technologies. Founded in 1978, it quickly became essential to smartphones, AI, automotive systems, and data centers. Moreover, Micron focuses on performance, energy efficiency, and scalable innovation. As a result, it empowers faster, smarter, and more secure digital solutions worldwide. Ultimately, Micron continues to shape the future of intelligent computing across industries.
Micron posted a record $9.3B in Q3 FY2025 revenue, fueled by strong AI-driven demand for DRAM and HBM memory. Net income hit $2.18B with EPS of $1.91, beating expectations. For Q4, the company projects up to $11B in revenue and EPS as high as $2.65. Backed by $12B in liquidity and a $200B U.S. investment plan, Micron is solidifying its role as a leader in next-gen semiconductor innovation.
Technically, MU has been trading above key moving averages, supported by strong volume and bullish momentum. The stock recently broke out of consolidation, confirming institutional interest and trend strength. However, with the Relative Strength Index (RSI) nearing overbought territory and price action approaching key Fibonacci levels, it’s an ideal moment to apply Elliott Wave analysis. This method helps us identify the current wave structure, assess whether the rally is impulsive or corrective, and anticipate potential reversal zones or continuation targets. By mapping out the wave count, we aim to align with the dominant trend while managing risk with precision.
MU Weekly Chart March 2025

The price broke below wave ((A)) low, which suggested wave ((B)) may be completed instead of wave (A). However, the ranging movement more likely indicated wave ((B)) was forming an expanding flat correction. We labeled wave (B) at the 83.54 low, and wave (C) was progressing as an impulse or an ending diagonal structure. The chart illustrates an upward impulse, targeting the 113.95–132.90 area for wave (C) and ((B)). Afterward, the market will likely react lower to continue wave ((C)) of II. On the other hand, if the market would break below wave (B), it would confirm the completion of wave ((B)) and the beginning of a downward wave ((C)).
If you’d like to deepen your understanding of Elliott Wave Theory, explore these resources: Elliott Wave Education and Elliott Wave Theory
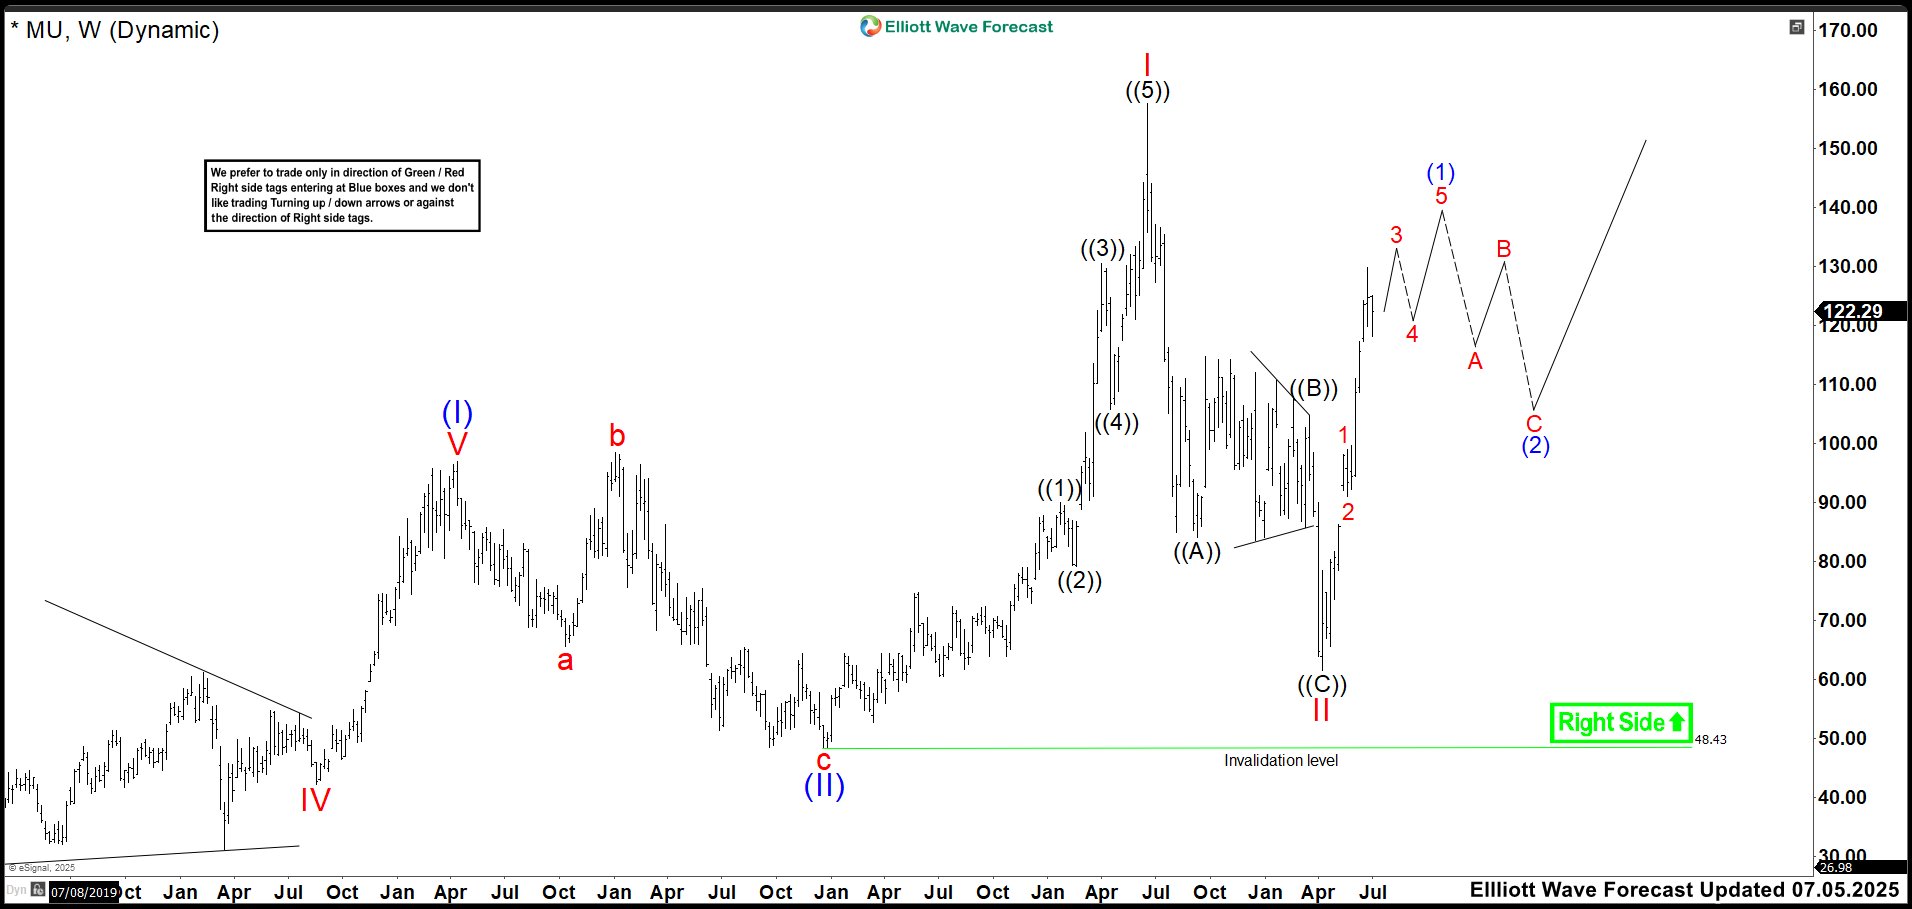
MU Weekly Chart July 2025

In this new weekly chart, we can see that the expected expanded flat did not materialize. Instead, the market broke below wave (B) at 83.54, confirming that wave ((B)) had already ended. This event coincided with the announcement of new international tariff changes by the United States. Wave ((B)) ended at 104.69, forming a triangular structure and initiating wave ((C)) of II. The market then experienced a sharp decline, reaching 61.54 and completing the correction on April 7. From that point forward, the price action turned decisively bullish, signaling the development of an impulsive advance.
Currently, we believe the stock is building wave (1), with price action entering wave 3 of (1). The structure suggests continued upward movement, although we expect some range-bound behavior as the market works toward completing the impulse. Ideally, wave 3 should reach the 132.82–137.41 zone, where we anticipate a potential bearish reaction that could mark the end of wave 3. Afterward, the market will likely remain in a consolidation phase before initiating a final rally to complete wave (1) and transition into a corrective phase.
Source: https://elliottwave-forecast.com/stock-market/micron-mu-surges-ai-wave-count-rally/

