
Towards the end of August 2020 the GBPNZD pair reversed and has been trending lower since. At EWF we always encourage traders to trade with the trend and not against it. Looking at the 1 Hour chart, GBPNZD was clearly trending lower and was in a correction mode at the start of last week which pushed price higher and was met with bears to push the pair back lower. There were visible signals where possible SELLERS were waiting to get in the market.
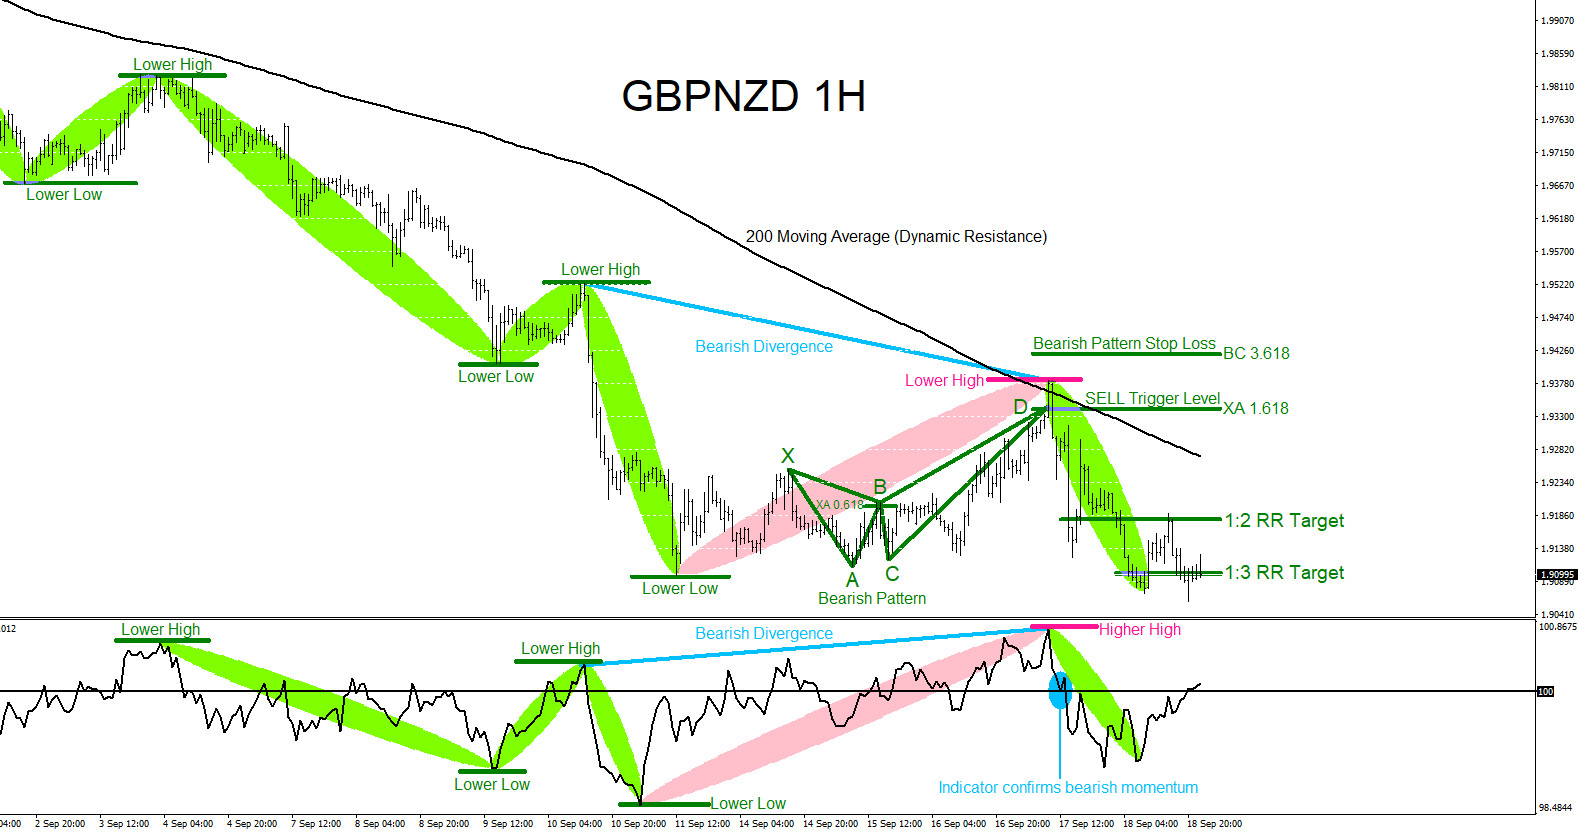
In the chart below, a lower low lower high sequence (green) in price confirmed the downside trend and the oscillator below was also moving together with the lower low lower high sequence. A signal for SELLERS was when the correction/pullback higher (pink) started to form a bearish trend continuation divergence pattern (light blue) where price was making a lower high but the oscillator was registering a higher high. A visible bearish market pattern (dark green) was also forming and triggered SELLS at the XA 1.618 where SELLERS started to enter the market. Bearish pattern (green) is invalidated if price breaks above the BC 3.618 so stops would be placed above that level. Another signal to sell the bearish pattern (green) was that price touched and respected the dynamic resistance (black 200MA). Price respecting the moving average was another sign that SELLERS were entering the market. As price reversed lower the oscillator confirmed bearish momentum (blue) and GBPNZD eventually hit the 1:2 RR and 1:3 RR targets. Traders should always have multiple strategies all lined up before entering a trade. When multiple strategies line up it allows a trader to see a clearer trade setup.
GBPNZD 1 Hour Chart September 18.2020
Of course, like any strategy/technique, there will be times when the strategy/technique fails so proper money/risk management should always be used on every trade. Hope you enjoyed this article and follow me on Twitter for updates and questions> @AidanFX