DOCU History: From contracts to offer letters to purchase orders, agreements are the foundation of doing business. Innovation and agreements are intrinsically connected. Both fuel each other and create that opportunity where ideas collide and intellectual capital starts to flow. Had it not been for the innovative thinking of certain businesses, industries and luminaries, opportunities to change the world would have been lost. Throughout history, agreements helped some of the most important innovations come to life.
From contracts to offer letters to purchase orders, agreements are the foundation of doing business. Yet many organizations still rely on manual, disconnected processes to get agreements done—wasting time and money, increasing errors and risk, and frustrating employees and customers.
In the early 2000s, Seattle-based entrepreneur Tom Gonser started DocuSign because he wanted to fundamentally change how business transactions happen. At that time the only available solutions were very complicated.
Docusign is one of the companies which gained tremendously after the pandemic hit the World. Gains can be attributed to growth seen due to more companies and businesses using Docusign to sign agreements, contracts and offers in a very safe manner by signing them online using Docusign. DOCU gained 254% since the low seen back in March 2020, today we will take a look at that rally and the long-term Elliott wave forecast for this ticker.
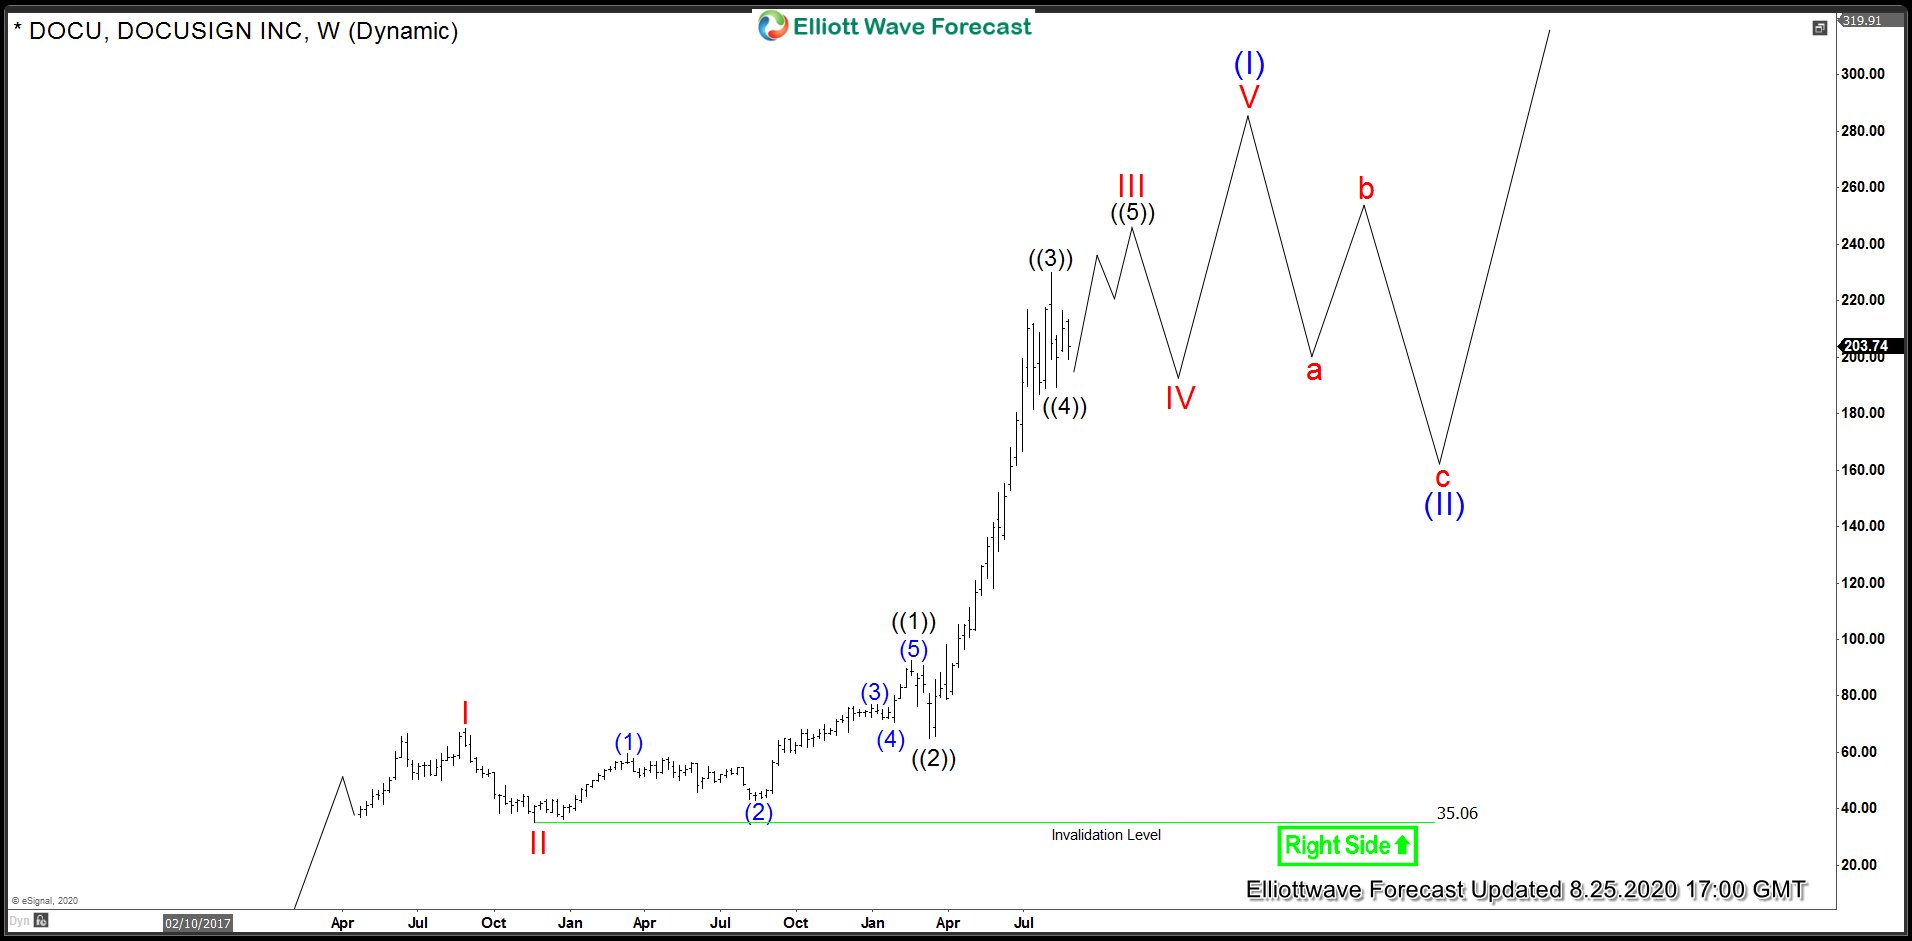
DOCU Weekly Elliott Wave Analysis
Weekly chart below shows DOCU rally to be unfolding as an Elliott Wave Impulse and the reason is extension in proposed wave III. Chart shows the rally to $68.35 was wave I, pull back to $35.06 was wave II, peak at $92.55 was wave ((1)) of III and the COVID-19 low in March 2020 at $64.88 was wave ((2)), strong rally to $229.83 was wave ((3)) as it reached and exceeded 261.8% Fibonacci extension of wave ((1)) and wave ((4)) pull back has either completed at $189.12 or could become a triangle or a double correction in which case we can see a break below $189.12 to complete wave ((4)) before a turn higher in wave ((5)) which should complete red III i.e. cycle from November 2018 low. Once wave III is complete, we expect a pull back in wave IV to correct the cycle from November 2018 low and then turn higher in wave V.

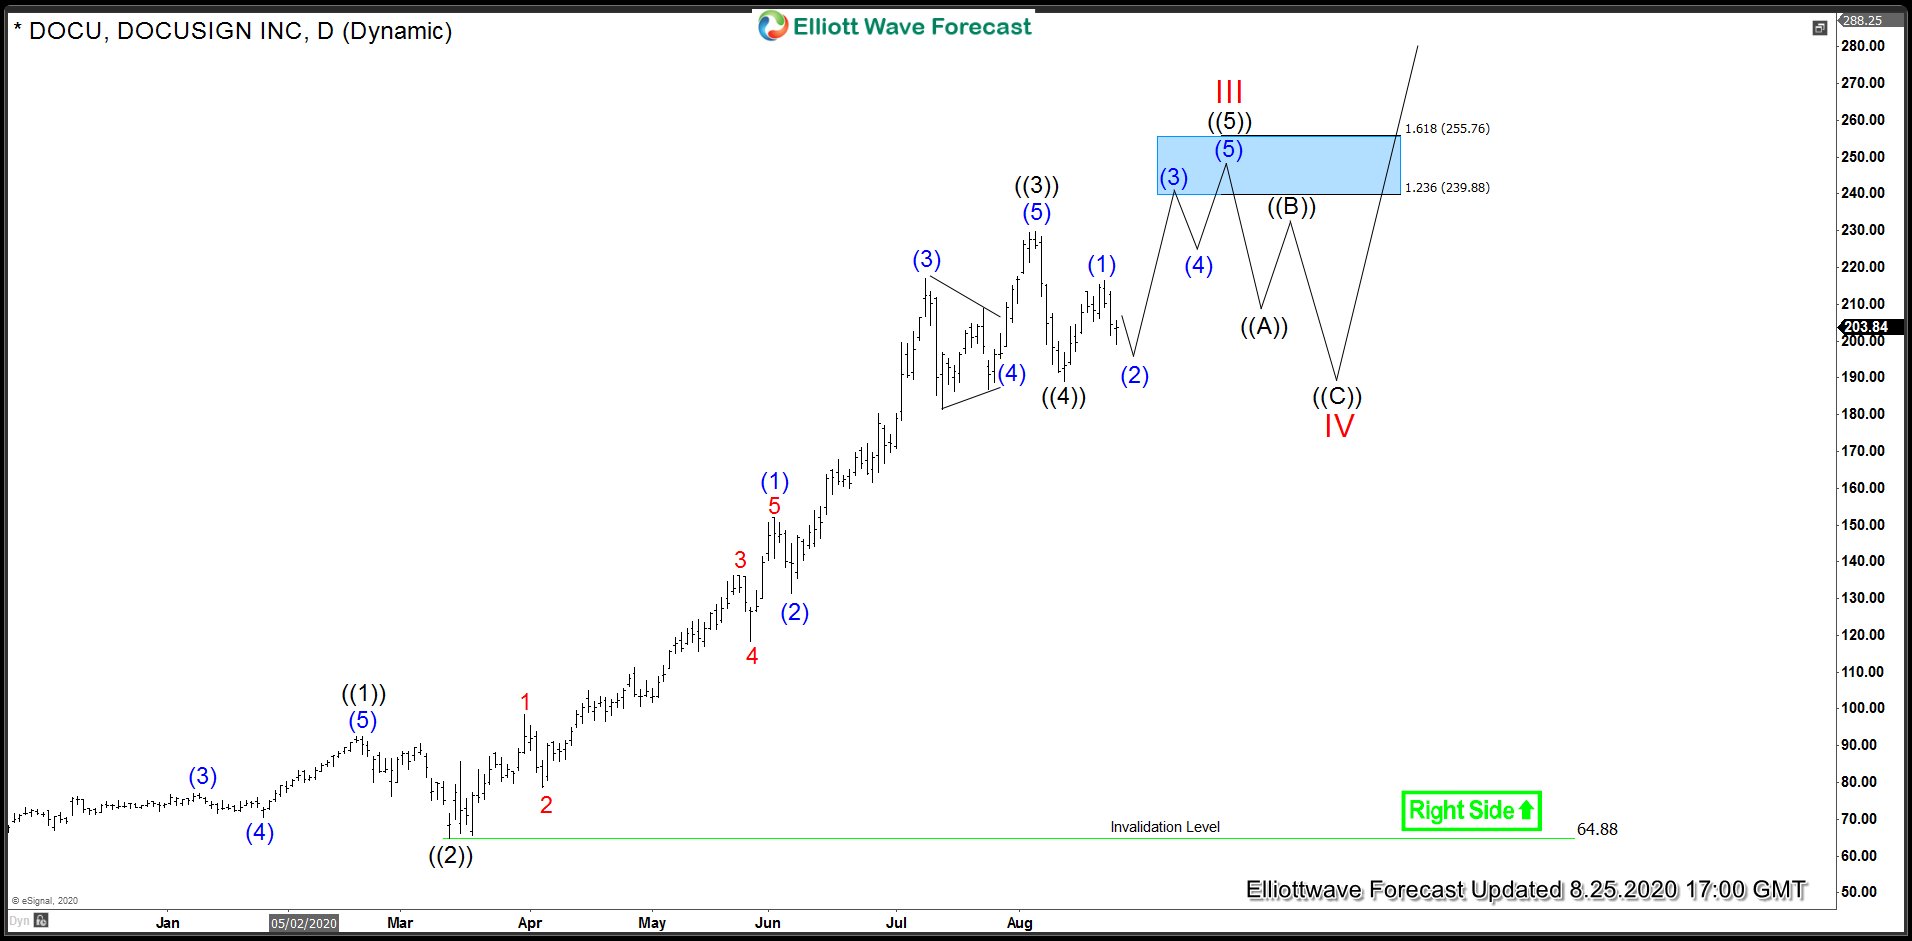
DOCU Daily Elliott Wave Analysis
Chart below shows the daily chart and as prices stay above $189.12, wave ((5)) is expected to extend higher toward $239.88 – $255.76 to complete wave ((5)) of III. Wave ((4)) can still take the form of a triangle or even become a double correction in which case it can see $175.07 – $149.03 area before a turn higher takes place in wave ((5)).

