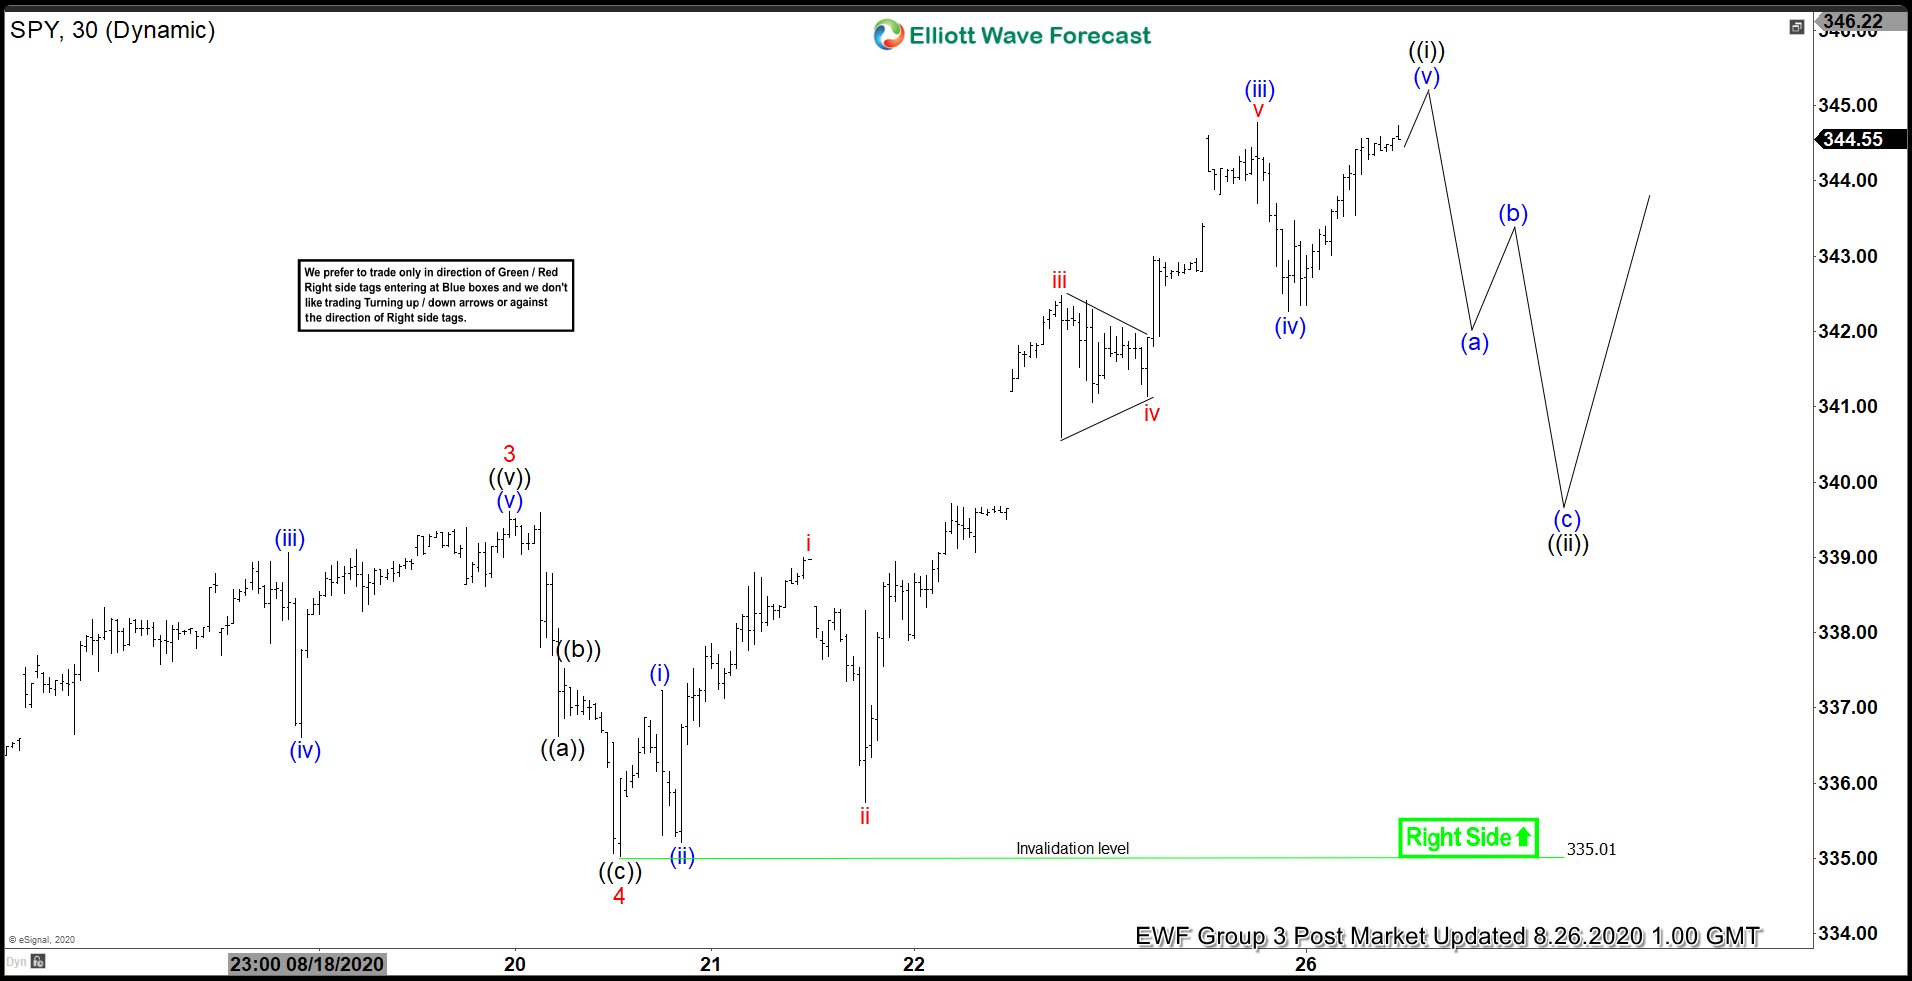
Elliott Wave View of SPY suggests the rally from July 25,2020 low has ended at 339.61 high as wave 3. Afterwards, the ETF did a pullback in wave 4 to correct that cycle. The dip unfolded as zigzag Elliott Wave Structure. From wave 3 high, wave ((a)) ended at 337.69 low. The bounce in wave ((b)) ended at 337.52 high. SPY then pushed lower in wave ((c)) and ended at 335.01 low. This completed wave 4 in the higher degree. Since then, the ETF has resumed higher from that wave 4 low. The rally has broken above wave 3 high, confirming that the next leg higher is in progress.
Up from August 20 low, wave (i) ended at 337.23 high and wave (ii) dip ended at 335.22 low. The ETF then extended higher in wave (iii) towards 344.77 high. Wave (iv) pullback then ended at 342.27 low. Currently, wave (v) is still in progress and could see another marginal high before ending 5 waves up from August 20 low as wave ((i)). Afterwards, 3 waves pullback should follow before upside resume again. As long as 335.01 low stays intact, expect the dips in 3,7 or 11 swings to find support for more upside. The alternate is that SPY could be ending wave 5 and also the cycle from July 14 low. If the ETF breaks the low at 335.01, then SPY could be doing a larger 3 waves pullback to correct the cycle from July 14 low before upside resume.
SPY 30 Minutes Elliott Wave Chart


