Hello fellow traders. In this technical blog we’re going to take a quick look at the Elliott Wave charts of DAX, published in members area of the website. As our members know, we’ve been calling rally in DAX within the cycle from the March low. Recently DAX made pull back that has unfolded as Elliott Wave Zig Zag pattern . In the further text we are going to explain the Elliott Wave Pattern and the Forecast.
Before we take a look at the real market example, let’s explain Elliott Wave Zigzag.
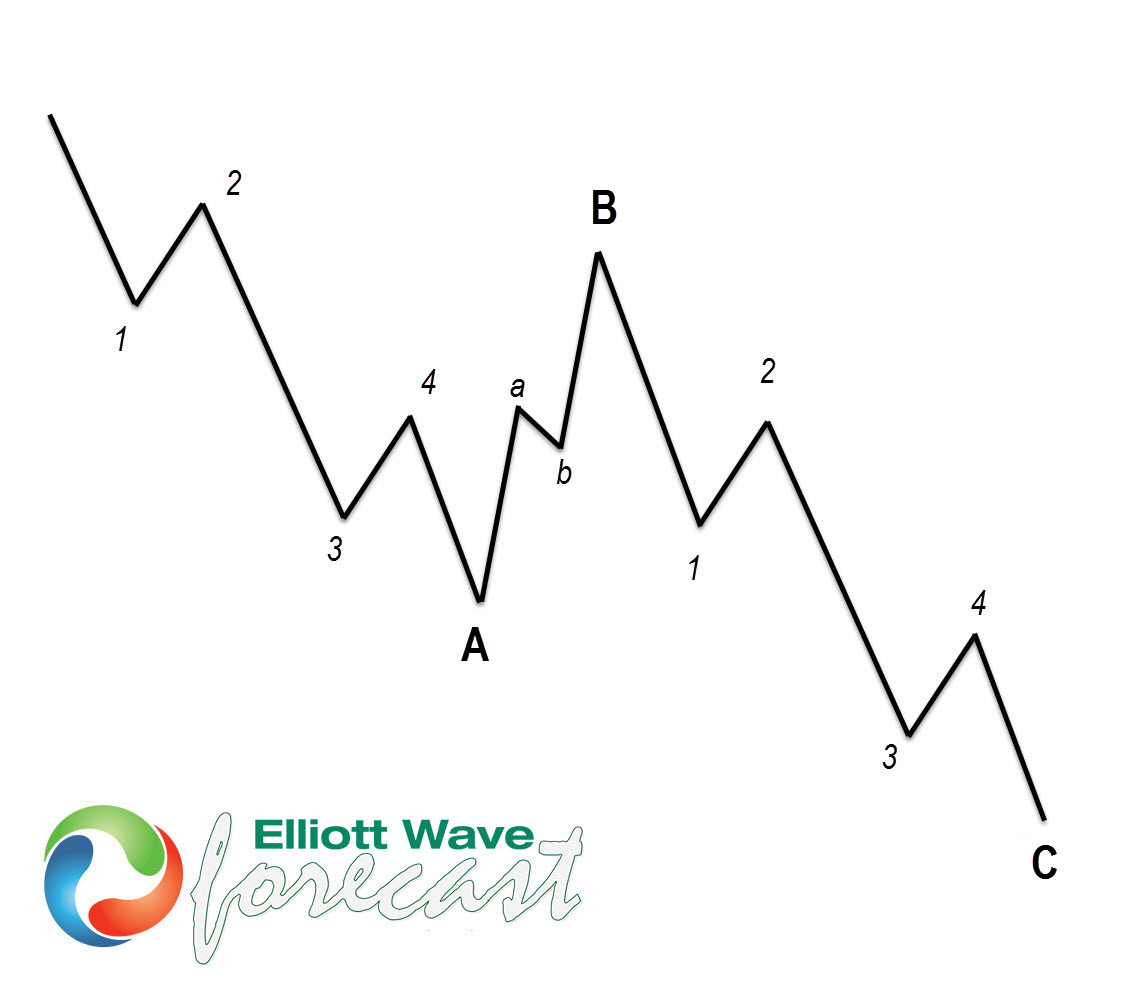
Elliott Wave Zigzag is the most popular corrective pattern in Elliott Wave theory . It’s made of 3 swings which have 5-3-5 inner structure. Inner swings are labeled as A,B,C where A =5 waves, B=3 waves and C=5 waves. That means A and C can be either impulsive waves or diagonals. (Leading Diagonal in case of wave A or Ending in case of wave C) . Waves A and C must meet all conditions of being 5 wave structure, such as: having RSI divergency between wave subdivisions, ideal Fibonacci extensions and ideal retracements.
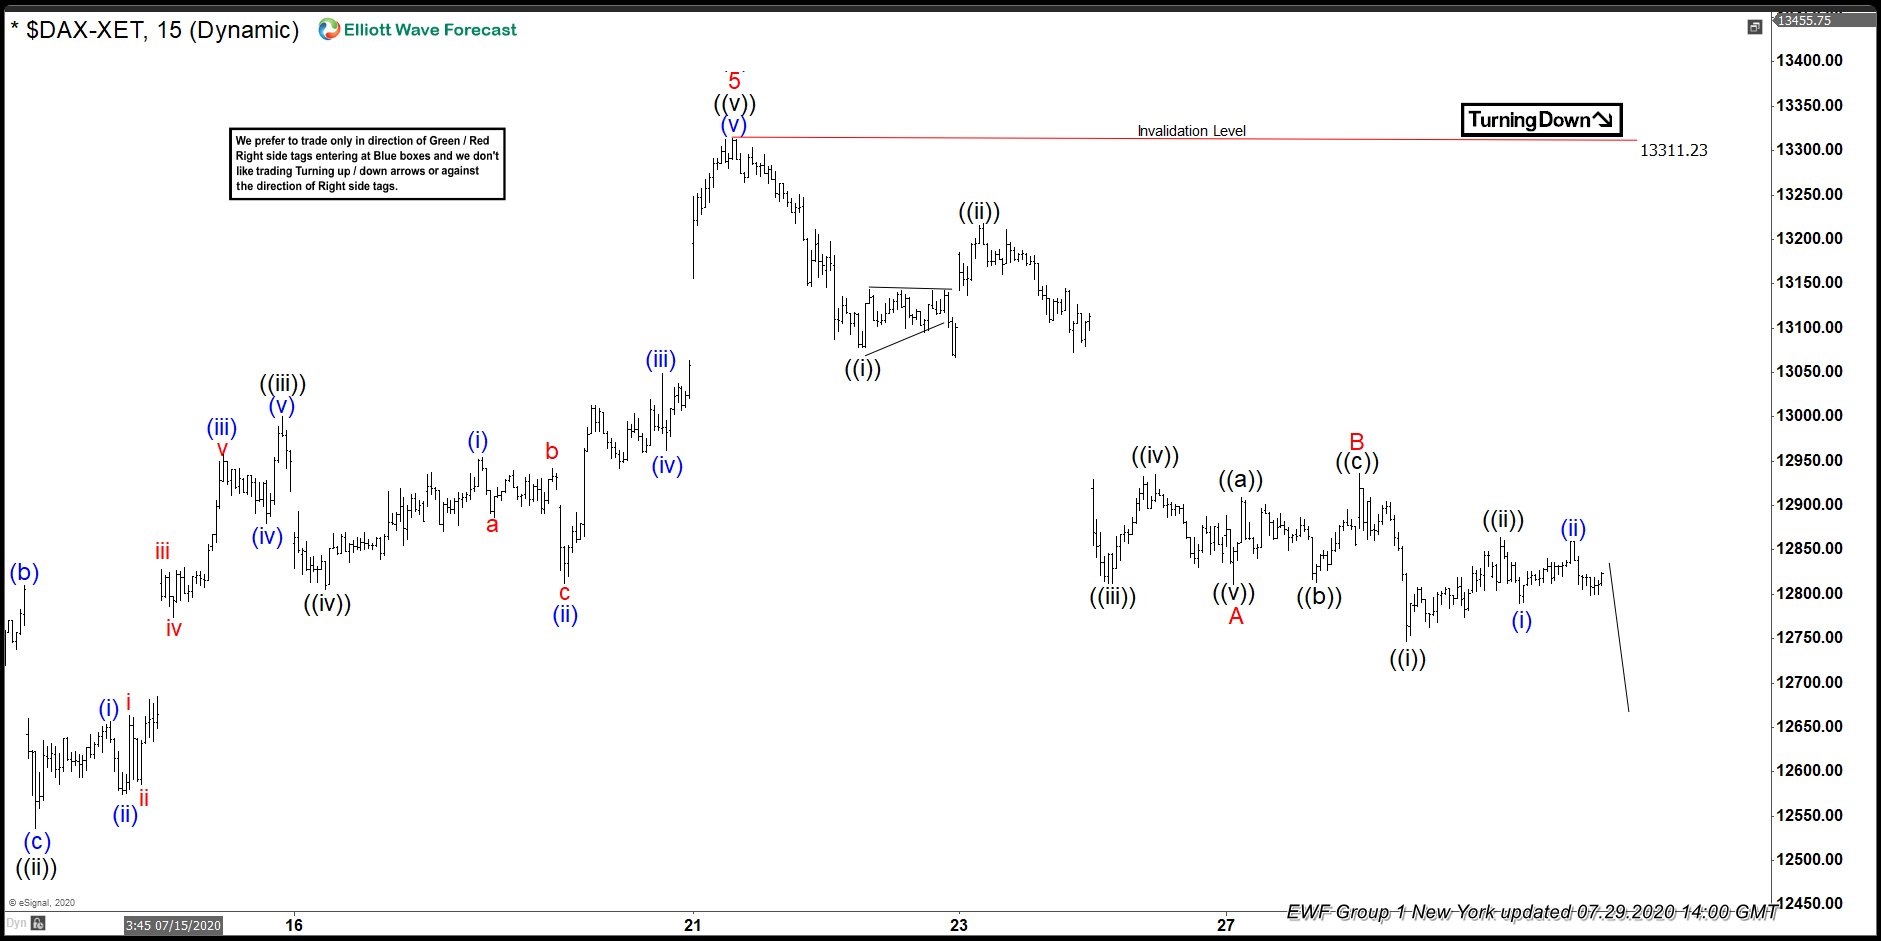
DAX 1 Hour Elliott Wave Analysis 7.29.2020
The index is currently giving us pull back that can be unfolding as Elliott Wave Zig Zag. We got 5 waves down from the 13311.2 peak, which is labeled as first leg A red. Then we got 3 waves bounce in shallow B red recovery and break toward new lows again. Now we should be ideally doing C red leg. Correction still looks incomplete at the moment, suggesting we can get more short term weakness before rally takes place again.
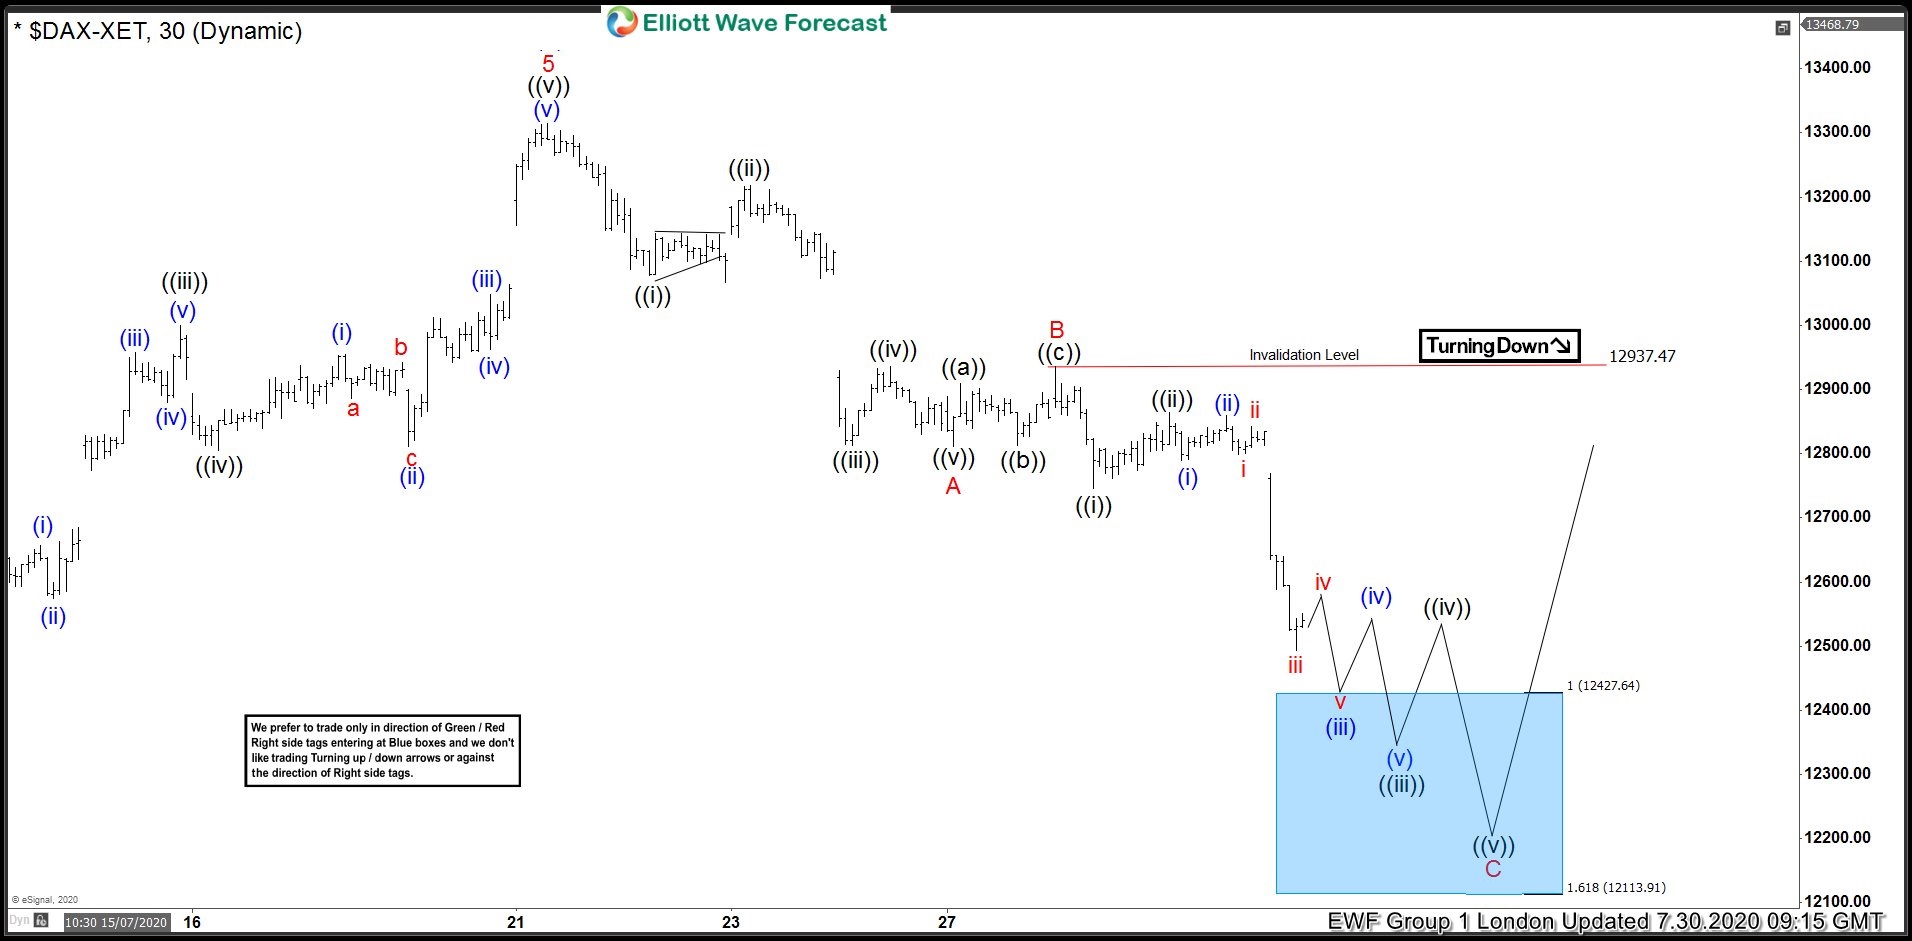
DAX 1 Hour Elliott Wave Analysis 7.30.2020
Pull back looks incomplete at the moment. As far as the price holds B red pivot 1297.4 ,we expect to see 5 waves down n ((c)) leg , ideally toward 12427.6-12113.9 ( buyers area) . At that area we expect buyers to appear for proposed rally or 3 waves bounce at least. As our members know, Blue Boxes are no enemy areas , giving us 85% chance to get a bounce.
You can learn more about Zig Zag Elliott Wave Patterns at our Free Elliott Wave Educational Web Page.
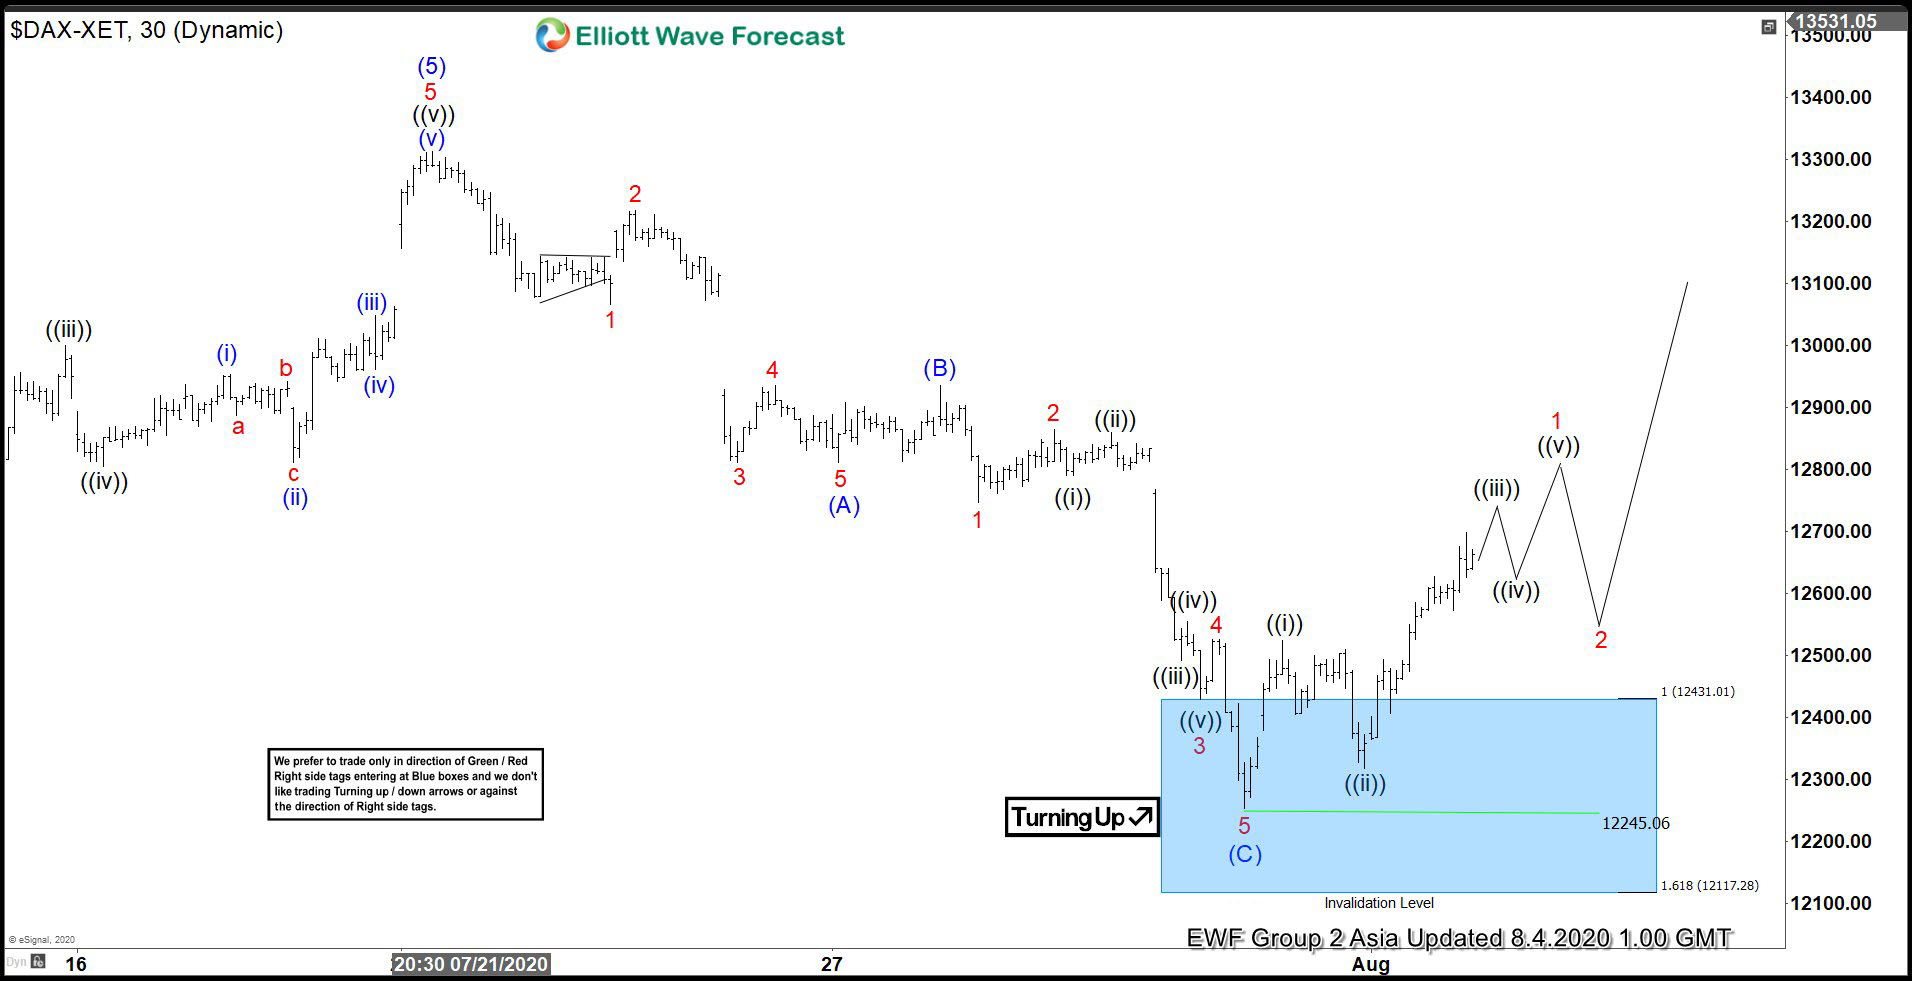
DAX 1 Hour Elliott Wave Analysis 8.4.2020
DAX found buyers right at the 12427.6-12113.9 ( Blue Box area). Pull back ended at the 12245.06 low. As far as that pivot holds, we would like to see further separation higher. We don’t recommend selling and favor the long side from the blue box. As the bounce has already reached 50 fibs against the middle pivot – (B) blue, members who took long positions should be risk free.
Keep in mind market is dynamic and presented view could have changed in the mean time. You can check most recent charts in the membership area of the site. Best instruments to trade are those having incomplete bullish or bearish swings sequences.We put them in Sequence Report and best among them are shown in the Live Trading Room.
Elliott Wave Forecast