
Since the corona virus hit in March earlier this year, price of Sugar future (SB) has remained depressed as demands projected to plummet. Prices fell sharply lower at 42% to 9.2 cents per pound in April. Over the past few weeks however, prices have made impressive returns due to drought in Thailand and weaker U.S dollar.
Since last month, the U.S Dollar continues to weaken against major currencies. In fact, in the month of July, the U.S. Dollar had the biggest decline in a decade. Weak US Dollar supports Sugar prices as Sugar future trades on the Intercontinental Exchange in US Dollar. As Brazil is the leading producer of this commodity and the local production costs are in Brazilian real, the currency exchange rate between the Real and US Dollar tends to impact the prices of the commodity.
From the supply side, the latest drought in Thailand is projected to limit the supply of sugar raws. Furthermore, Brazil has become the second-leading country with the highest number of coronavirus and fatalities. Thus, the pandemic may significantly affect the production and logistics of the commodity in the coming months. Market is in the process of finding a new equilibrium with lower demand and supply at the same time.
The central bank stimulus can also potentially spark the rally in commodity asset classes. During the 2008 global financial crisis, quantitative easings have been a boon to the commodities sectors. In 2020, far higher stimulus levels from central banks and government may do the same thing.
Sugar Daily Elliott Wave Chart
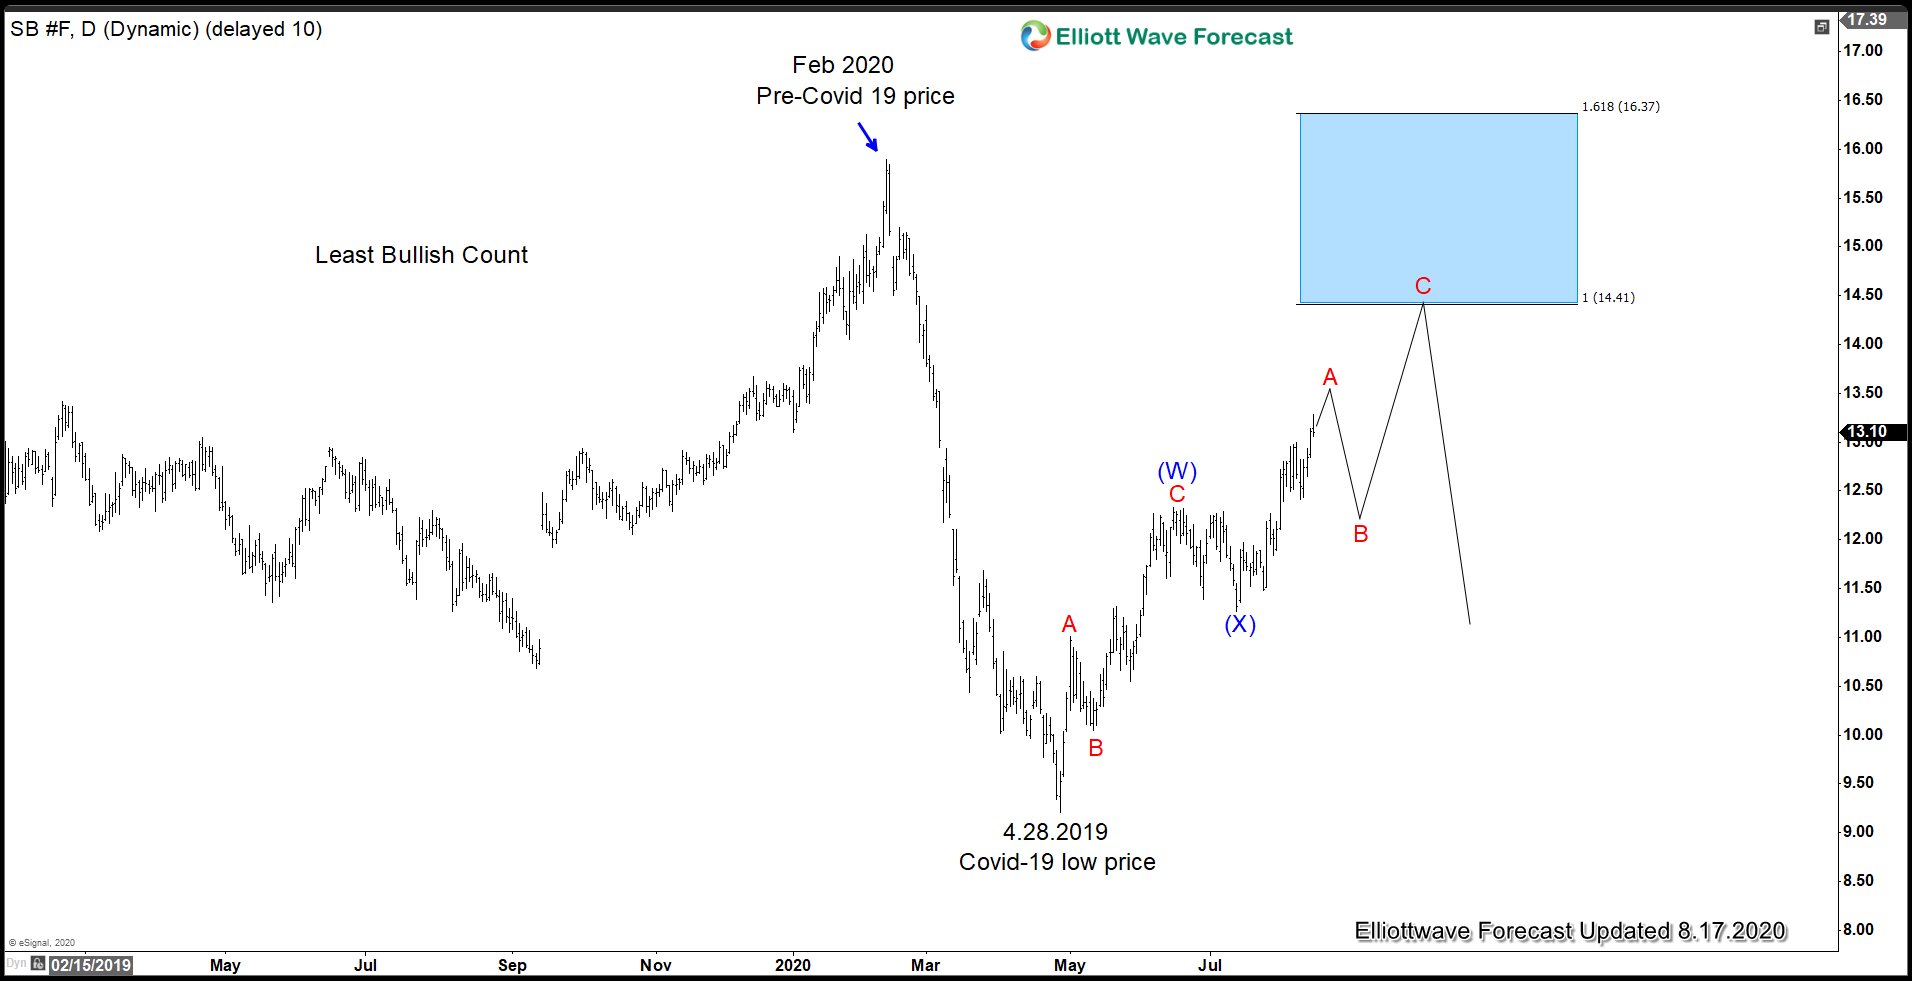
A possible Elliott Wave scenario above suggests the rally from April 28 low is unfolding as a double zigzag Elliott Wave structure. In this scenario, Sugar prices has a target higher towards 14.4 – 15.1 area to complete the sequence from April 28 low. This view is valid as long as wave (X) low pivot at 11.27 remains intact. A more bullish scenario however is possible where the rally from April 28 low is unfolding as an impulse. A more bullish scenario can be considered if Sugar breaks and closes above 2011 bearish trend line shown below
Sugar Weekly Chart
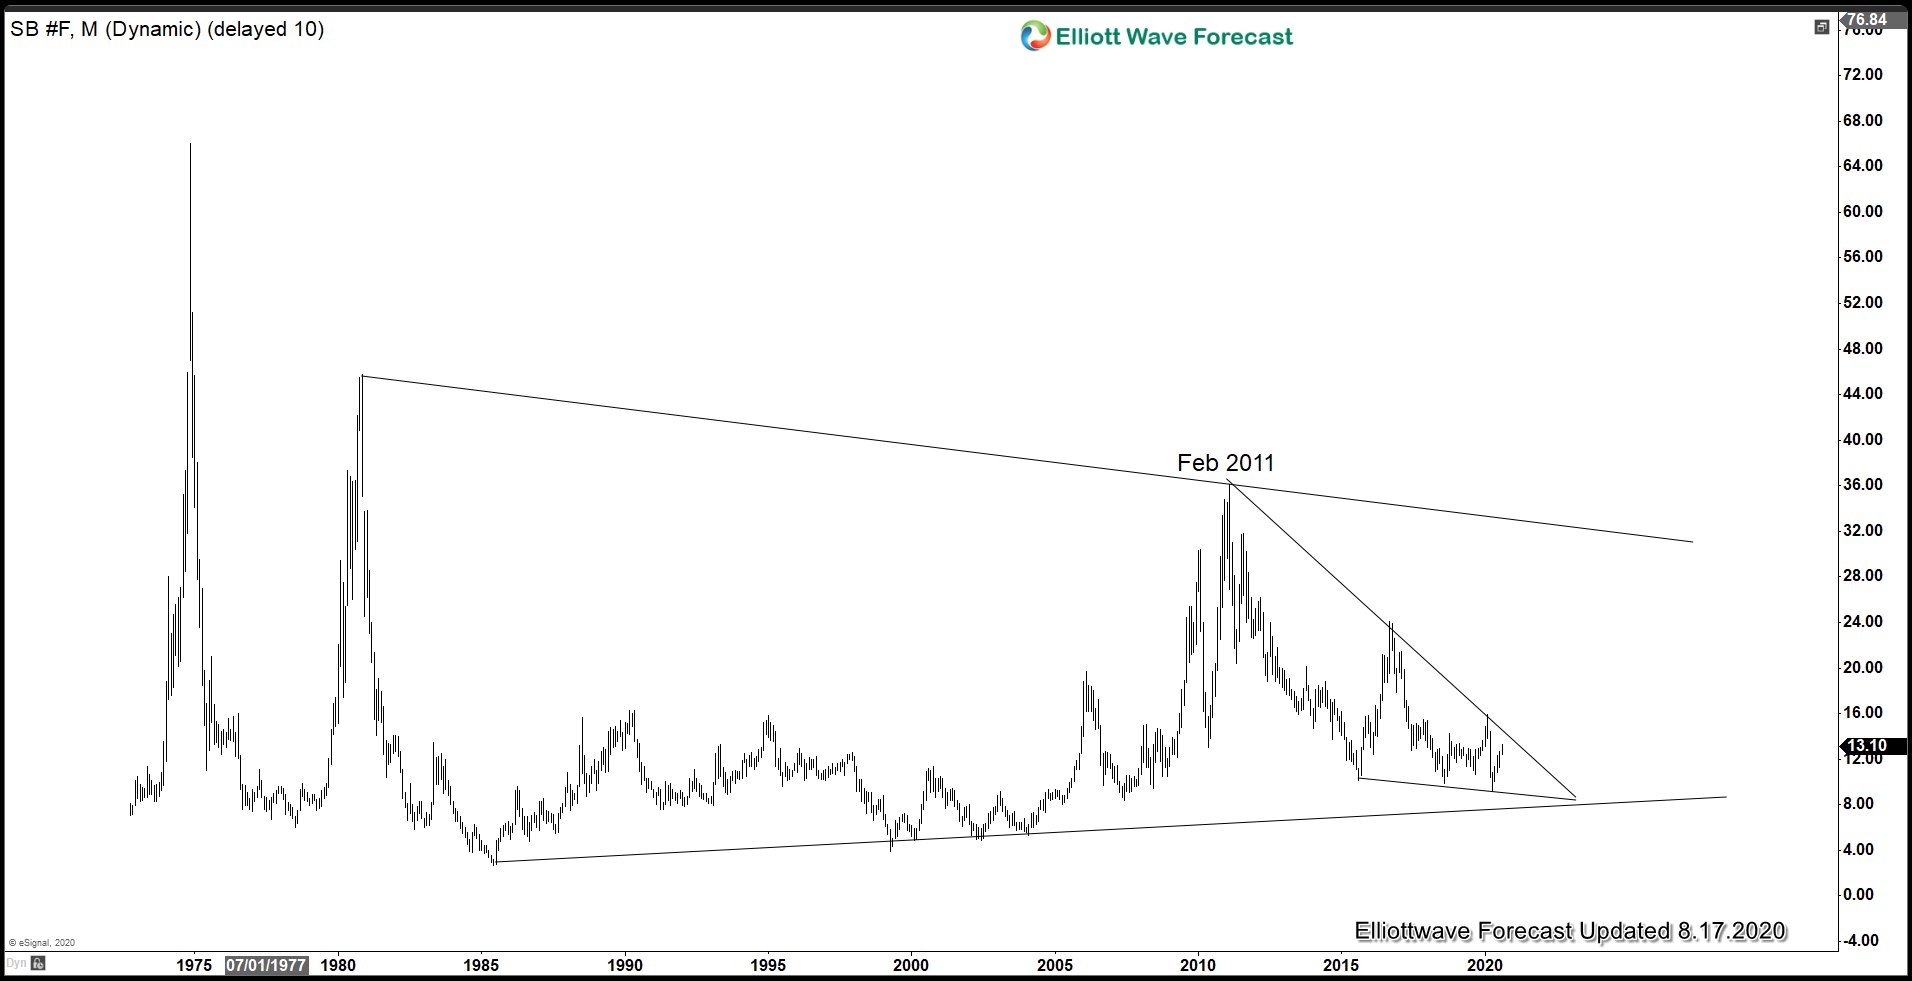
Weekly chart above shows that Sugar has traded in what looks to be a wedge from February 2011 high. If Sugar future can close above the descending trend line from Feb 2011 high, a more bullish scenario can be considered where Sugar has started to do bigger move to the upside. The rally from April 29 Covid-19 low in this case can unfold as an impulse.