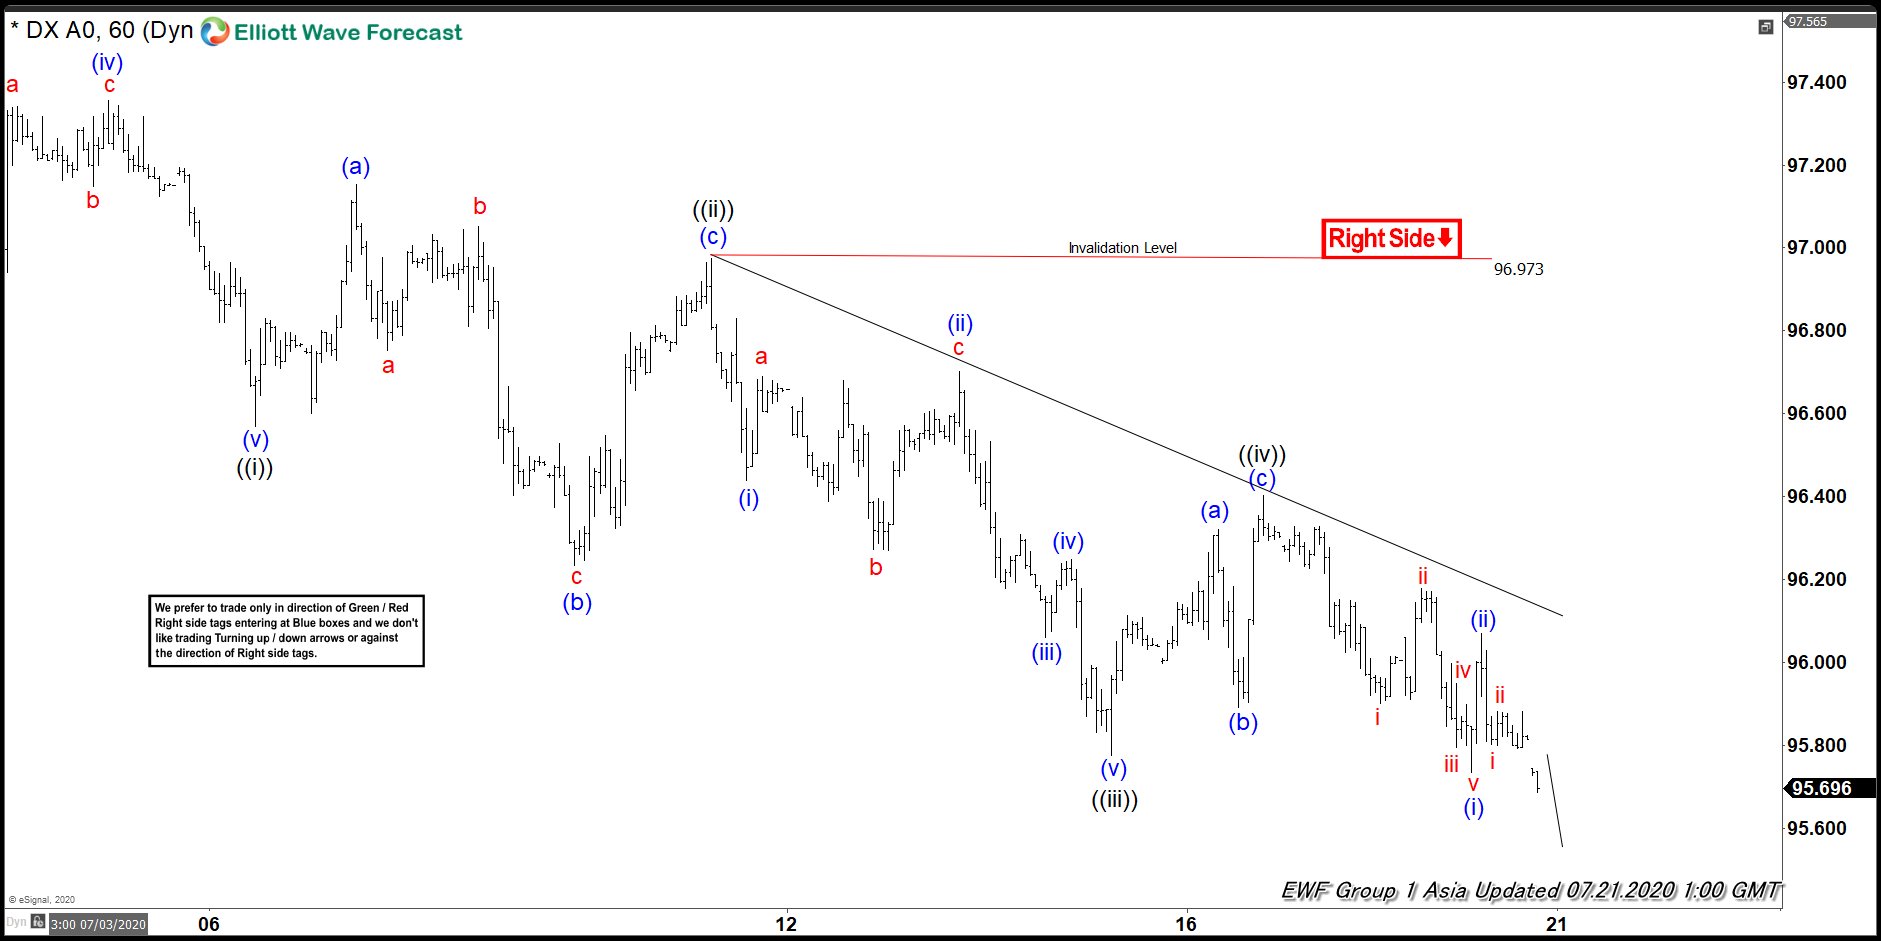
DXY 1 hour chart below shows that the index has continued to extend lower and can see more downside before ending wave ((v)). The index ended the cycle from June 30 high as wave ((i)) at 96.57 low. The bounce in wave ((ii)) then unfolded as a running flat Elliott Wave Structure. Up from July 6 low, wave (a) ended at 97.15 high. Wave (b) dip ended at 96.23 low. The index then extended higher in wave (c), which ended at 96.97 high. This completed wave ((ii)) in higher degree. The Index has since declined lower from that high.
Down from wave ((ii)) high, the index ended wave ((iii)) at 95.77 low. The internal subdivision of wave ((iii)) unfolded as 5 waves impulse Elliott Wave Structure. Wave (i) of ((iii)) ended at 96.44 low and wave (ii) ended at 96.70 high. Wave (iii) ended at 96.06 low and followed by a bounce in wave (iv), which ended at 96.25 high. The push lower in wave (v), which completed wave ((iii)) in the larger degree, then ended at 95.77 low. Afterwards, the Index bounced in wave ((iv)), which ended at 96.40 high. Wave ((v)) is currently in progress. Down from wave ((iv)), wave (i) of ((v)) ended at 95.73 low and wave (ii) bounce ended at 96.07 high. Since then, the Index has declined lower and broke below previous wave (i) low. While below 96.97 high, expect the bounce in 3,7, or 11 swings to fail for more downside before wave ((v)) ends. The 100% – 123.6% extension of wave (i) – (ii) measured from wave ((iv)) between 95.25-95.40 is the minimum target lower.
DXY 1 Hour Elliott Wave Chart