
Hello fellow traders. In today’s blog, we will recap a blog I did last month about Lufthansa.
In that blog, I talked about the reasons why the stock should remain weak in the coming weeks and months. Of course, we need to understand that the market never moves in one straight line. There will be pullbacks/bounces, after continuing its trend. Therefore, I was pointing out that the stock was trading at the 61.8 extension area from January 2018 peak. And that the internal cycle from 2/26/2019 peak has ended and correction against that peak should be seen.
Now, let’s have a look at the charts and compare them to each other.
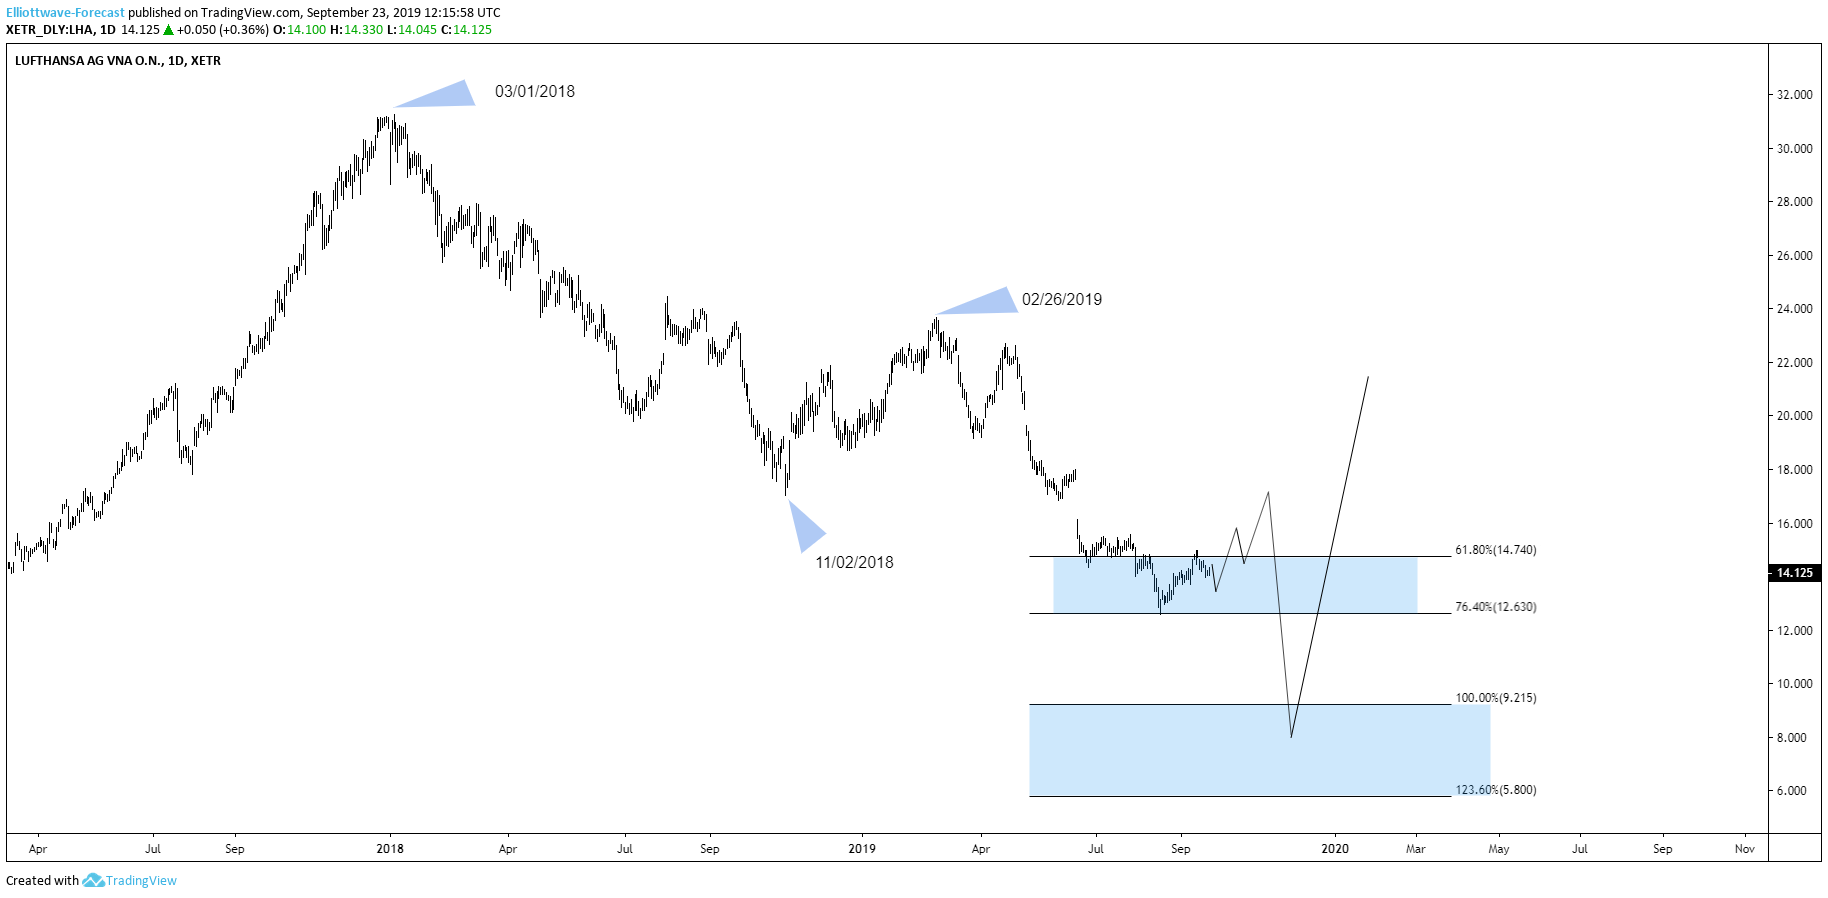
Lufthansa AG 09.29.2019 Daily Chart Analysis
Lufthansa AG 10.20.2019 Daily Chart Analysis
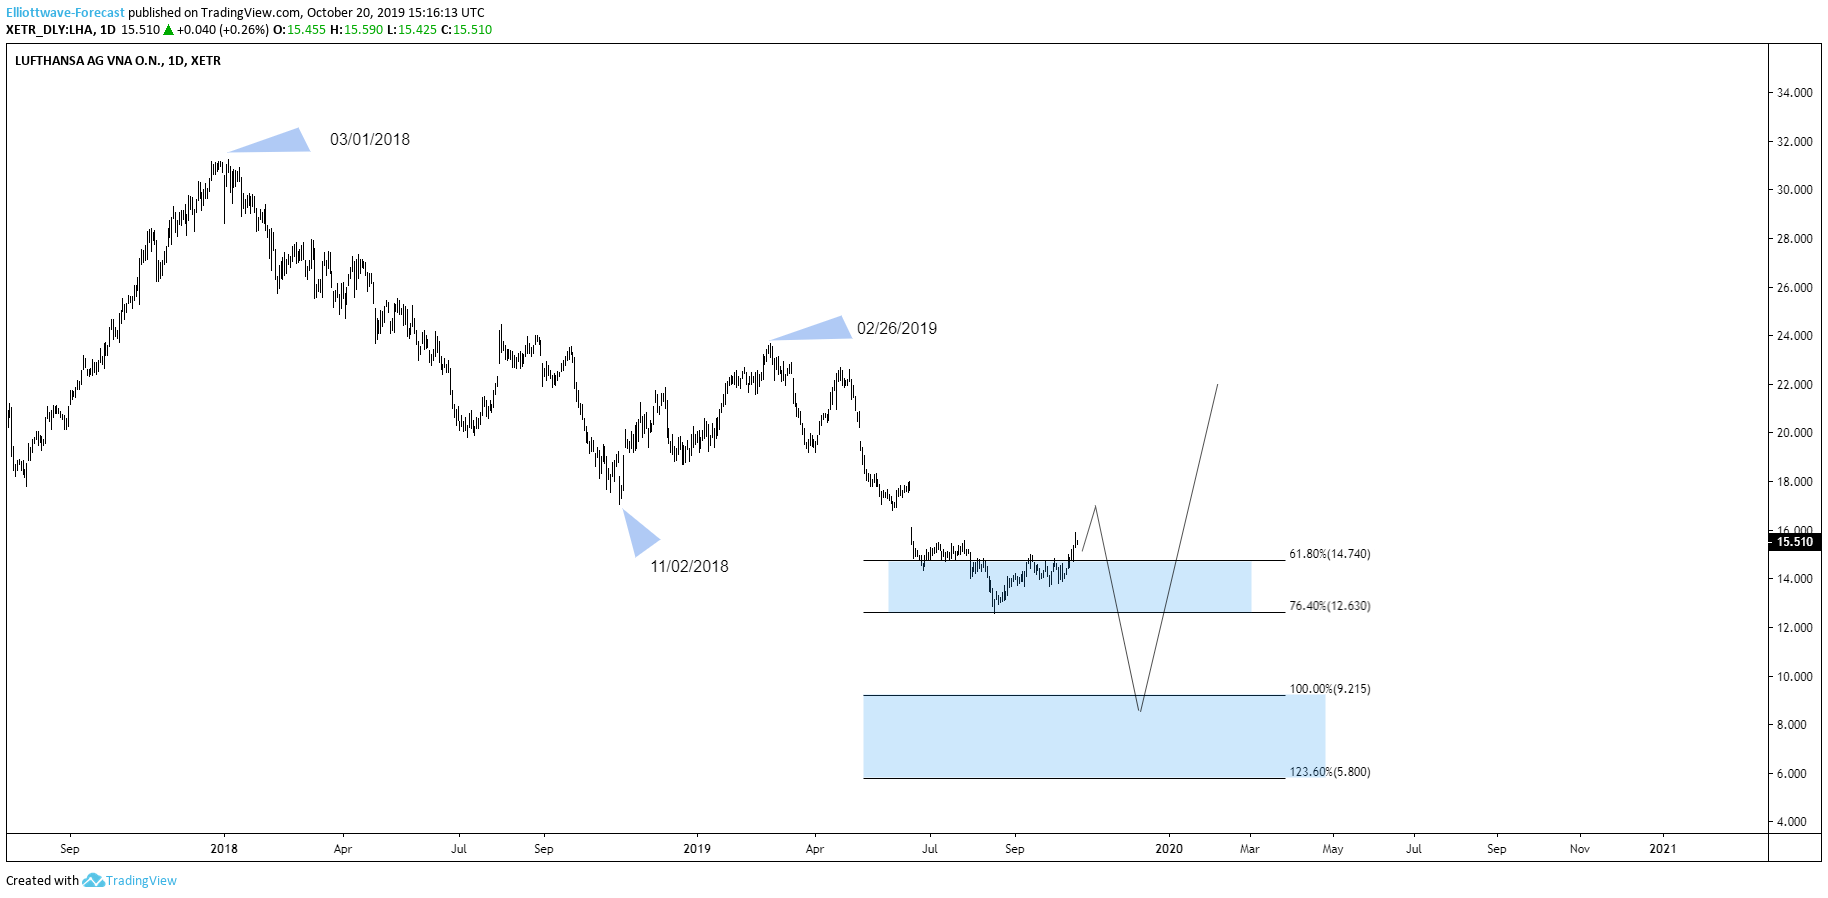
In the first chart above you can see that I was expecting a pullback from the first blue box area. If you now see the second chart, you can see nicely that the stock infact started a bounce.
However, it does not change the overall outlook from last month. Lufthansa should ideally now see equal legs from the 2018 peak towards 9.22-5.80 area. This area can be used based on Elliott Wave Hedging for a good buy investment opportunity. Summarizing, the stock should see more downside in the next coming weeks and month into 9.22-5.80 area where a bigger reaction higher in favor of the Lufthansa stock should ideally be taking place. I hope you liked this comparison.