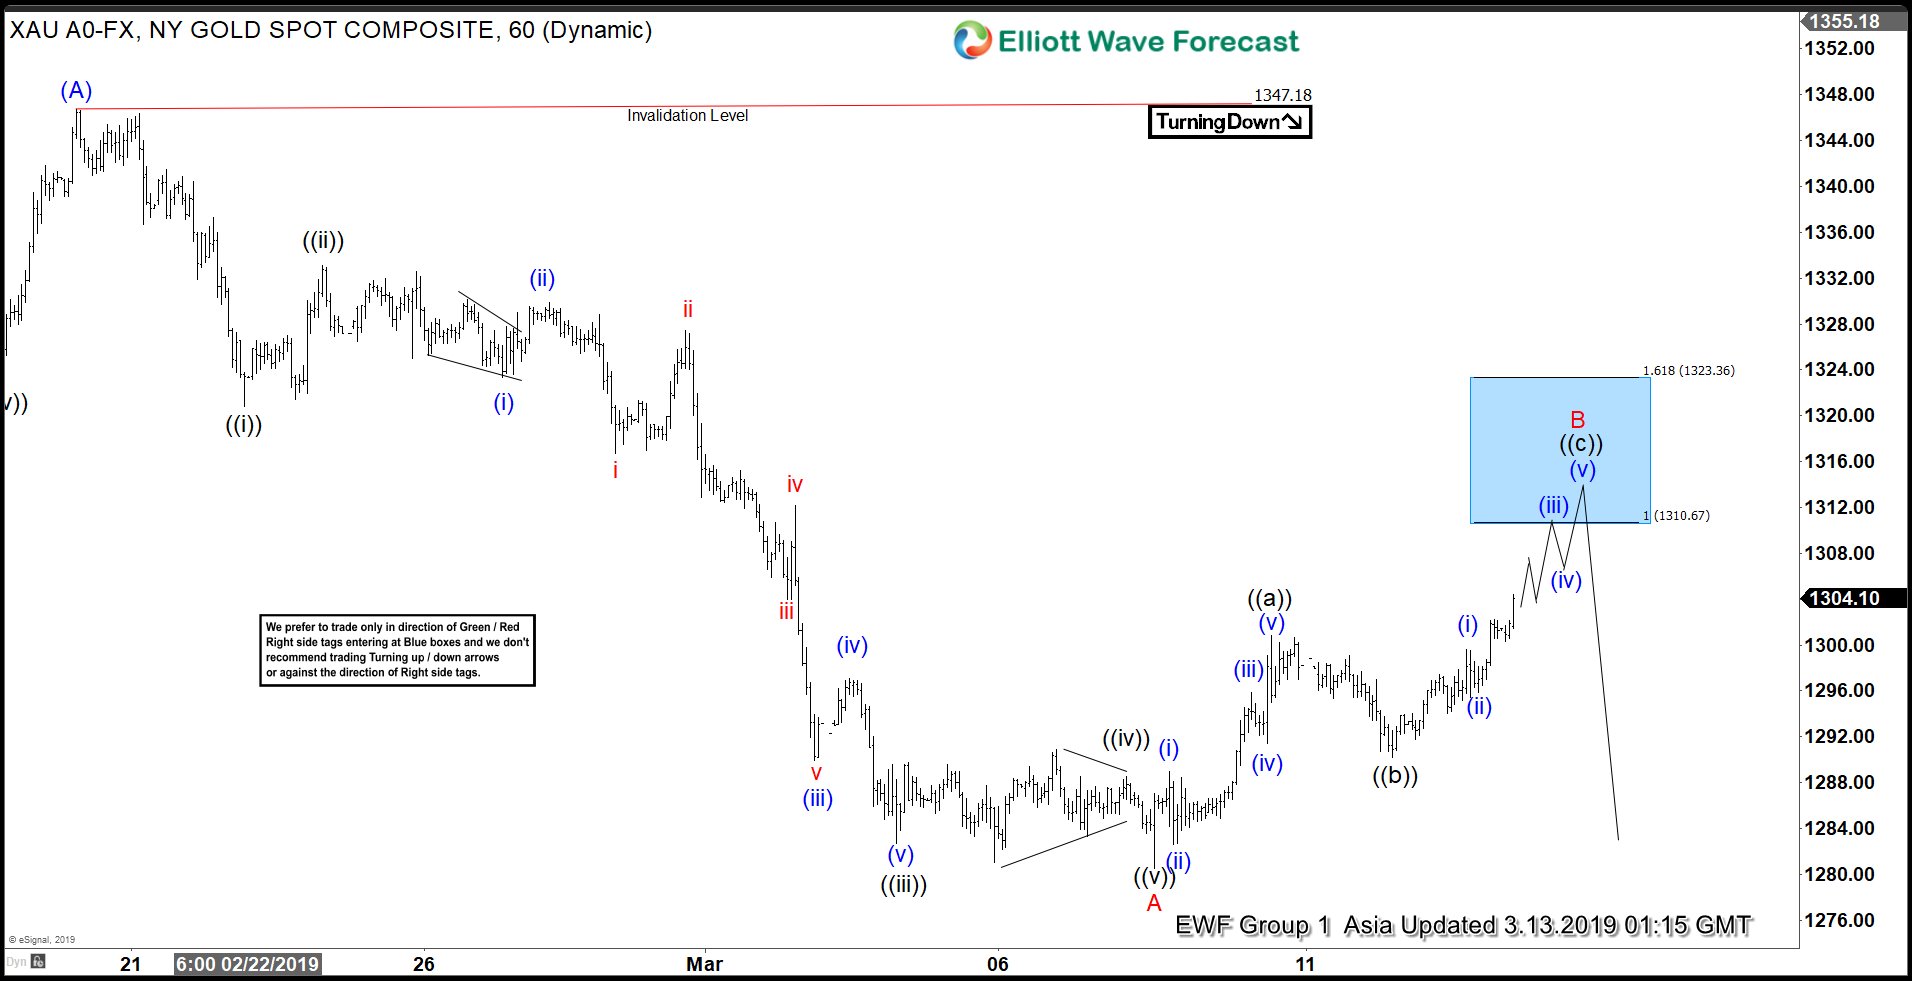
Gold has ended the cycle from August 16, 2018 low at $1347.18 as wave (A). The yellow metal is in the process of correcting the cycle from August 16, 2018 low in 3, 7, or 11 swing within wave (B). Near term, the decline from $1347.18 looks impulsive and ended wave A at $1280.49. The internal of wave A unfolded as a 5 waves impulse Elliott Wave structure. Down from $1347.18, wave ((i)) ended at $1320.79 and rally to $1333.13 ended wave ((ii)). Gold then resumed lower in wave ((iii)) at $1282.7, bounce to $1288.53 ended wave ((iv)), and finally wave ((v)) of A ended at $1280.49.
Wave B bounce is in progress to correct cycle from Feb 20, 2019 peak in 3, 7, or 11 swing. Current structure of wave B bounce is unfolding as a zigzag Elliott Wave structure. Up from $1280.49, wave ((a)) ended at $1300.8 and wave ((b)) ended at $1290.2. Expect Gold to see profit taking and sellers at $1310.67 – $1323.36. From this area, the yellow metal can either extend lower below wave A or at least pullback in 3 waves. As far as the current rally fails below $1347.18, we can’t rule out another leg lower to continue the correction from August 16, 2018 low.
1 Hour Gold Elliott Wave Chart