
Over the next few weeks Japanese Yen strength should drive prices of AUDJPY lower within a downward sloping channel. The current incomplete Elliott Wave structure also supports this expectation of further downside.
In this article we’ll explore the basics of the current wave structure and its parallel channel. This combined analysis charts a great area to look for AUDJPY to bottom in a measured area. Traders can use this projection to go long the Australian Dollar vs the Japanese Yen.
The Model of the Double-Three Elliott Wave Corrective Structure
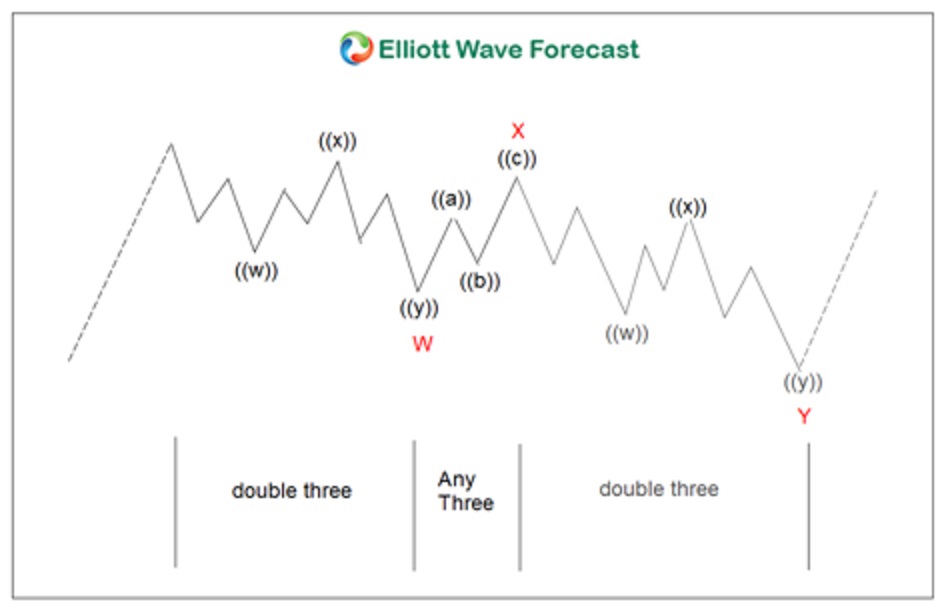
Generic View of a Double-Three Correction[
The picture above depicts a typical model of a combination corrective pattern known as a “double-three correction” labeled (W-X-Y). Double-three corrective patterns comprise of two corrective patterns in the same direction separated by one corrective pattern in the opposite direction. The first corrective pattern labels as W, the second Y. The corrective pattern in the opposite direction labels as X.
The Channeling and Measured Moves of Corrective Waves
It is often an observation and even an expectation that the corrective price action in any financial instrument will oscillate within a parallel channel. In the chart below for AUDJPY we observe this very phenomenon. These channels can also help traders target an end to the overall structure.
Another simple yet invaluable tool employed by EWF analysts to target the end of corrections involve what are known as “Measured Moves” or “Equal Legs”. These observations are nothing more than symmetrical measurements in the larger degree corrective wave labels. I.E. 1:1 measured moves between the two corrective waves that move in the same direction.
For instance, in the AUDJPY chart, look at the larger blue-highlight area at the bottom of the chart. This area simply represents the measurement of equality (1:1) between the origin of the entire correction [at the point with blue (W)] to the bottom of red wave w and projecting that measurement from the top of the red wave x. This measurement gives AUDJPY technical traders a target for the bottom of not only wave y, but the entire corrective sequence from the structure’s origin.
Weekly Bar Chart of the Channeled Double-Three Corrective Sequence for AUDJPY
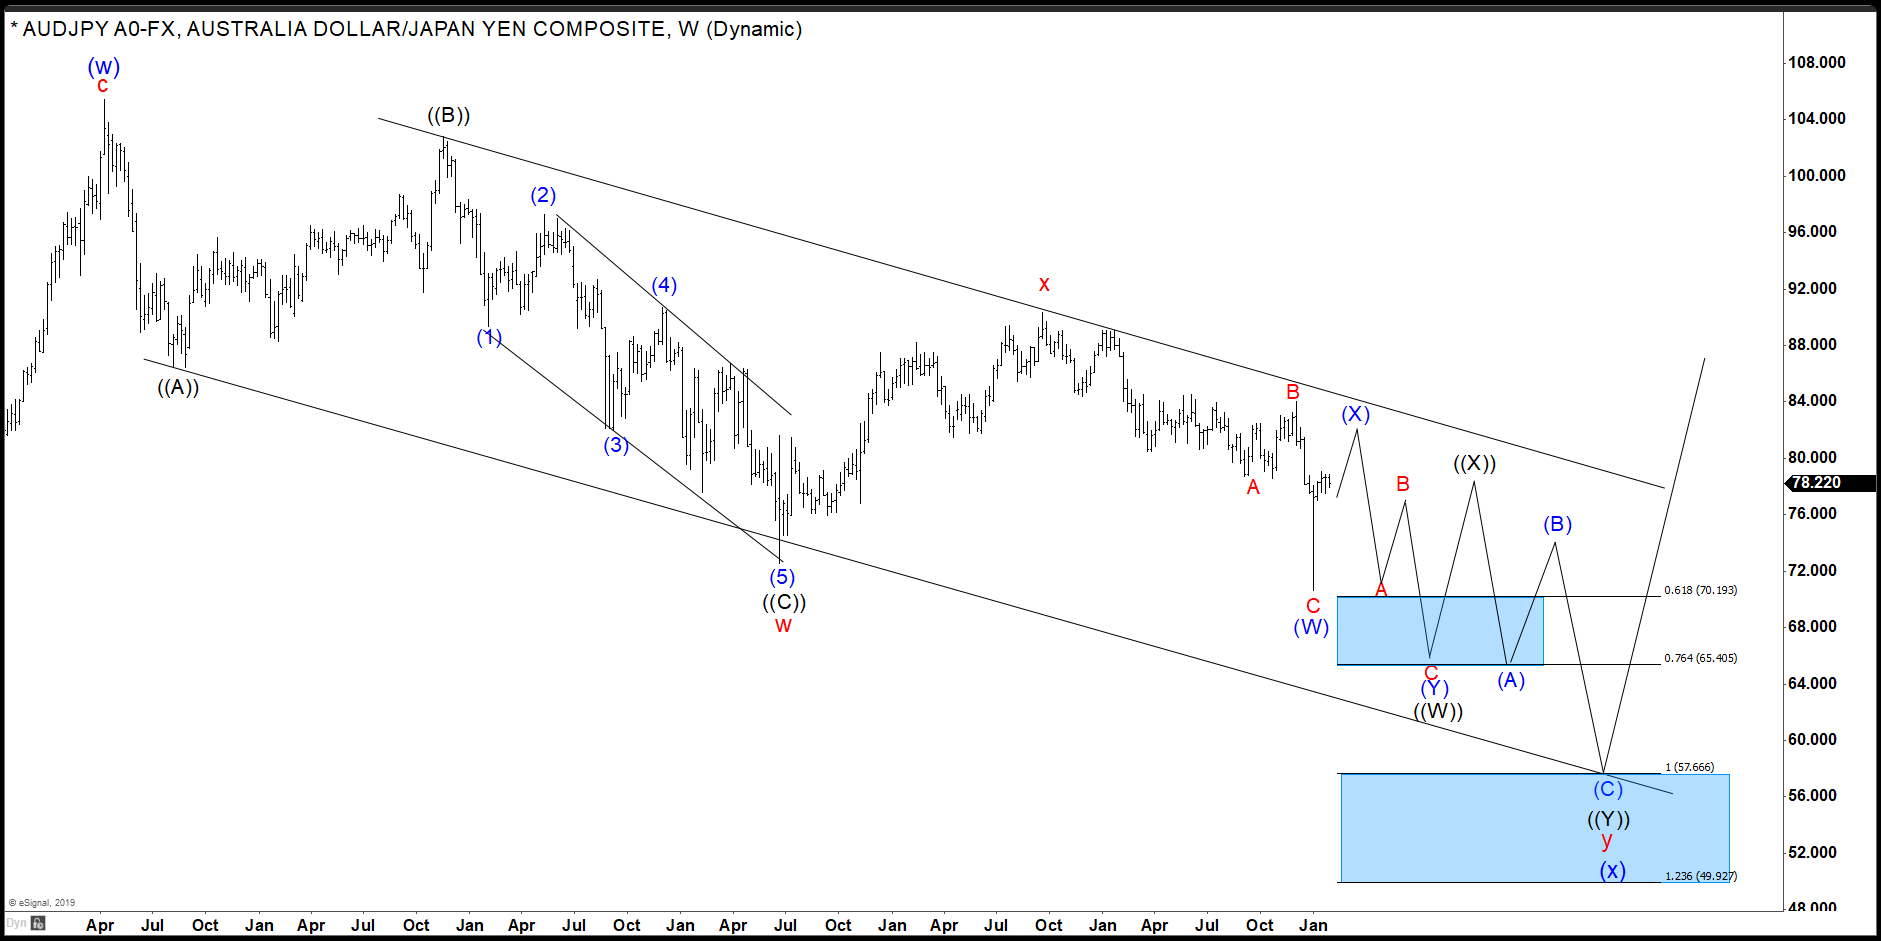
AUD/JPY Downward Channel Double-Three Correction
Confidence is high that AUDJPY is headed for further swing declines in the intermediate term toward the measured level near 57.70. Shorter-term traders should look for selling opportunities to exploit this expected downside target.
Certainly the analysis above suggests positional traders prepare to go long in the blue area. This area highlights an intersection between the measurement of equality and parallel channel line bottom. Since the price action to the downside is overall corrective in nature the upside will be tremendous. Furthermore the upside target is tremendous if the 57.70 area triggers the long. The minimum objective lies above 100.00.
To Your Success,
James
EWF Analytical Team