
In this technical blog, we are going to take a look at the past performance of Apple ticker symbol: $AAPL, 1 hour Elliott Wave charts that we presented to our clients. We are going to explain the structure and the forecast below.
Apple 1 Hour Elliott Wave Chart From 01/13/2019
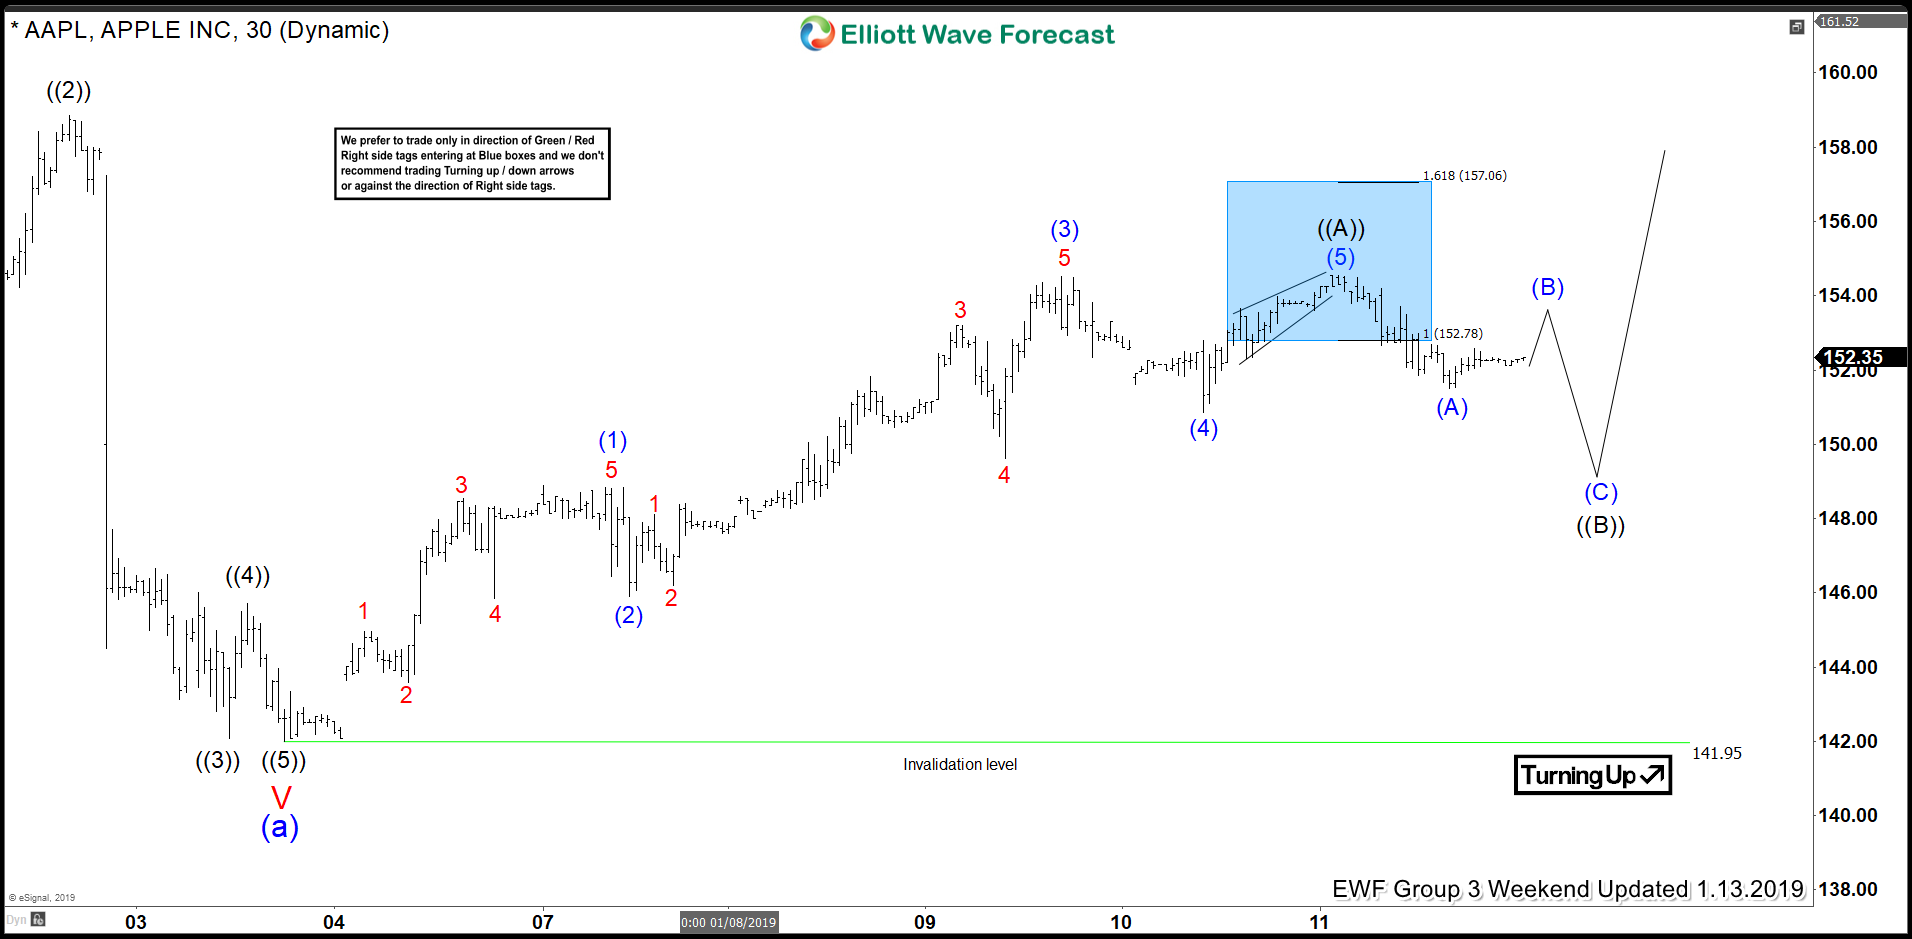
Above is the 1 Hour Elliott Wave Chart from 1/12/2019 Weekend update, in which the Apple stock ended the decline from 10/03/2018 peak at $142.06 low seen on 1/03/2019 in super cycle degree wave “(a)”. Up from there, the stock rallied higher in 5 waves structure thus suggested that the bounce higher will continue higher for another 5 waves structure at least in a zigzag pattern. Up from $142.06 low, the stock ended the 5 waves rally at $154.54 high in primary wave ((A)) and expected to make a 3 wave pullback before more upside is seen.
Apple 1 Hour Elliott Wave Chart From 1/15/2019
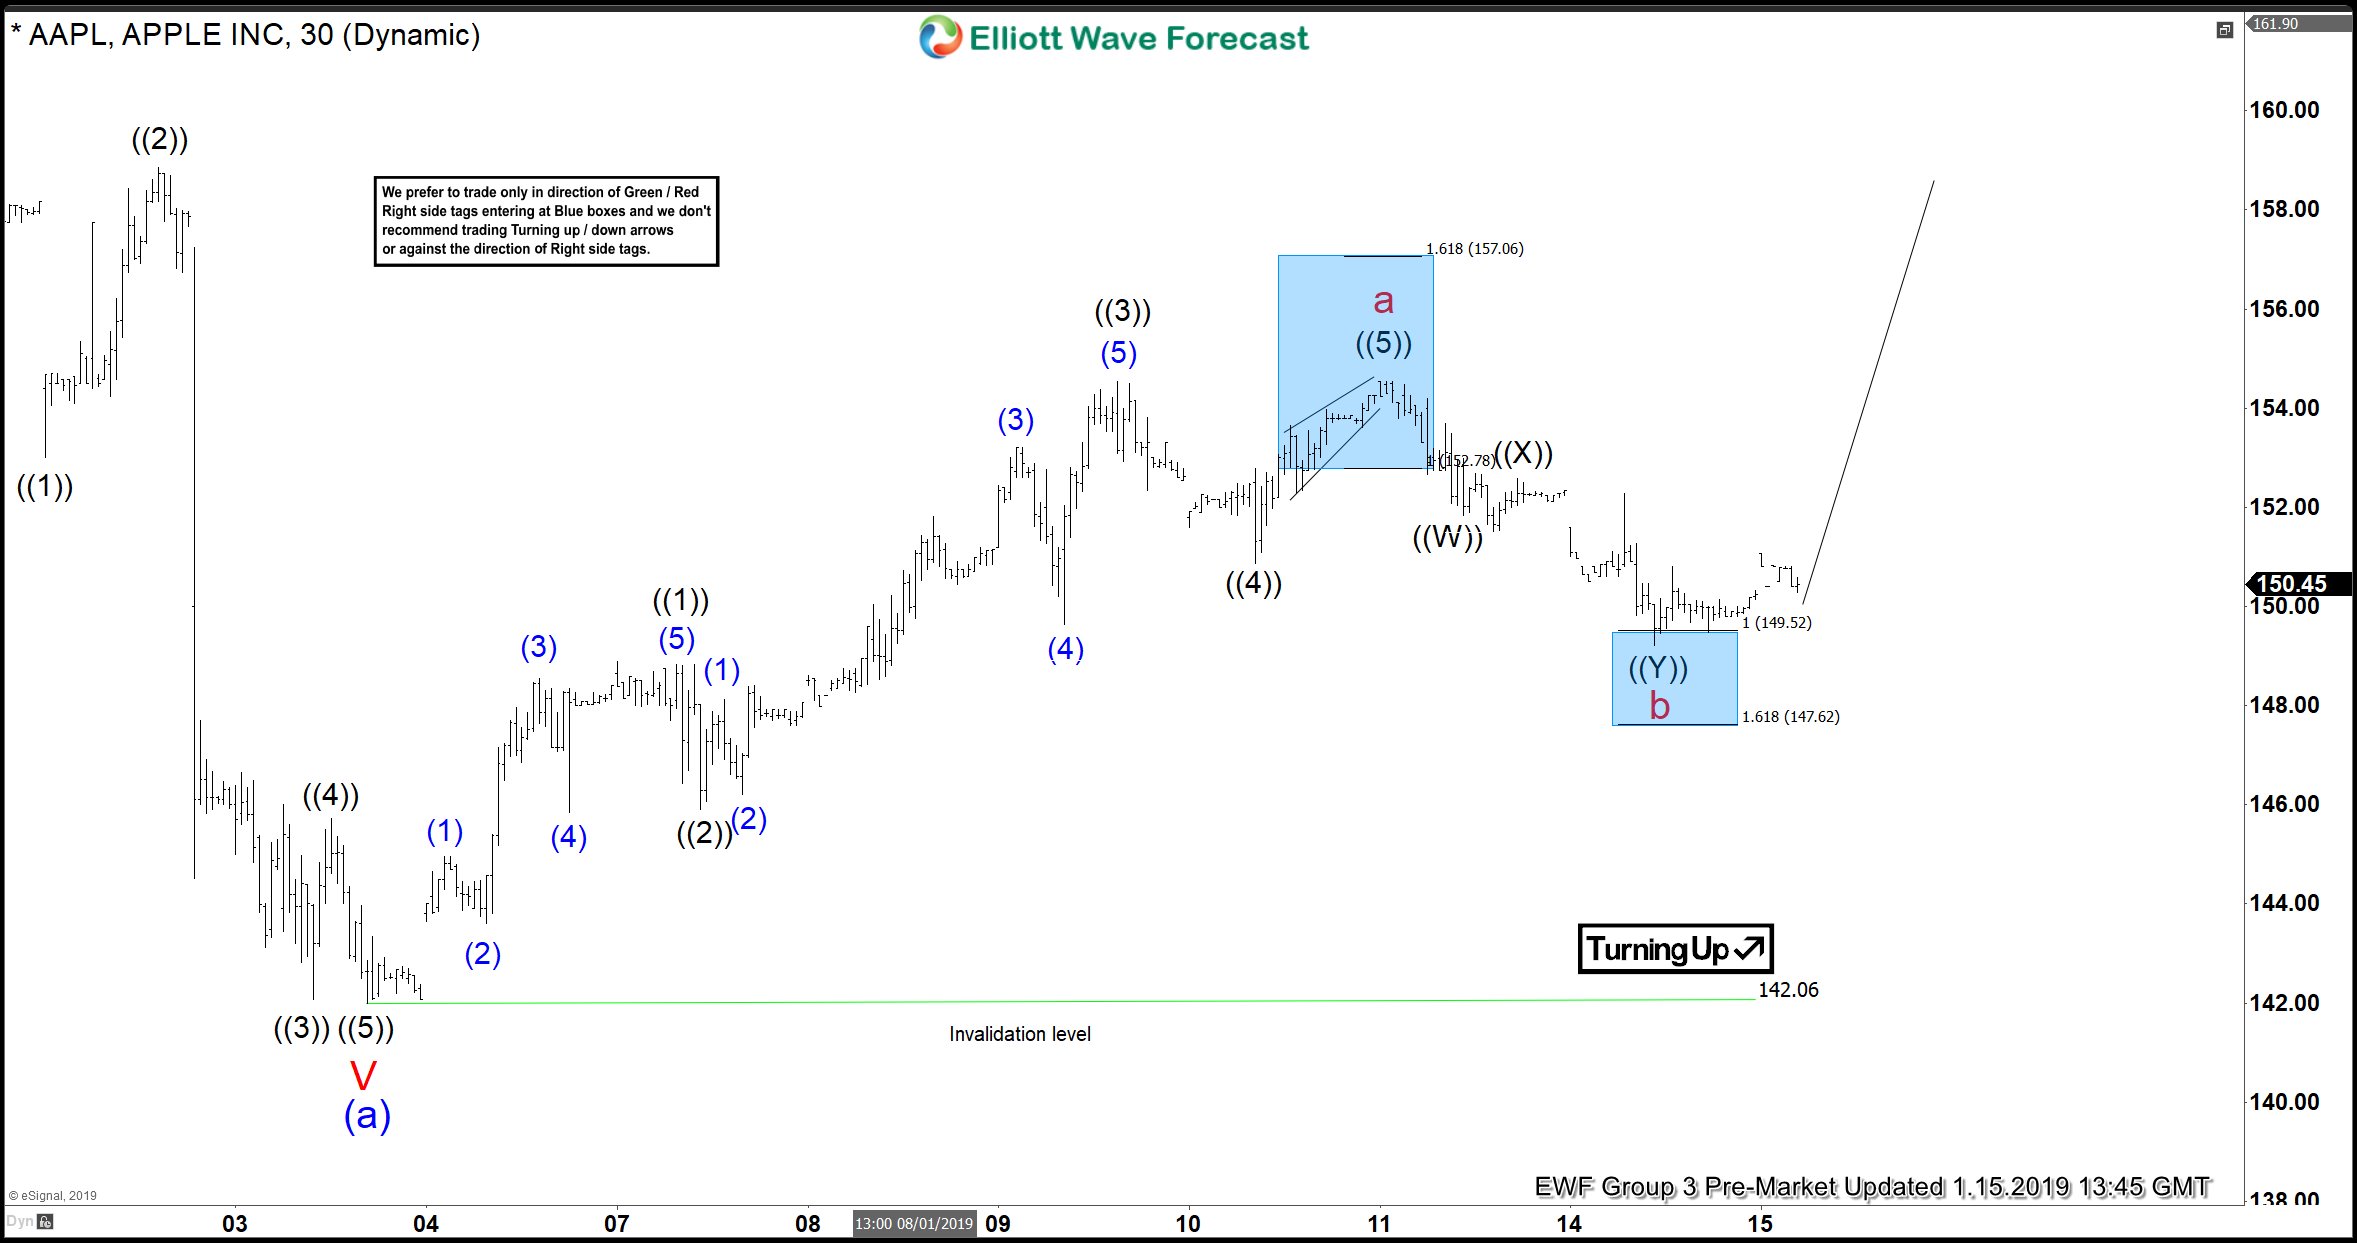
Apple 1 hour Elliott wave Chart from 1/15/2019 Pre-Market update, in which Apple made a 3 wave pullback in cycle degree wave “b” as double three structure where primary wave ((W)) ended at $151.84. Primary wave ((X)) ended at $152.59 and Primary wave ((Y)) ended at $149.22 low within cycle degree wave “b”. After reaching 100%-161.8% Fibonacci extension area of primary wave ((W))-((X)) at $149.52-147.62. Note that, we have adjusted the degree of the bounce slightly based on our distribution system.
Apple 1 Hour Elliott Wave Chart From 1/23/2019
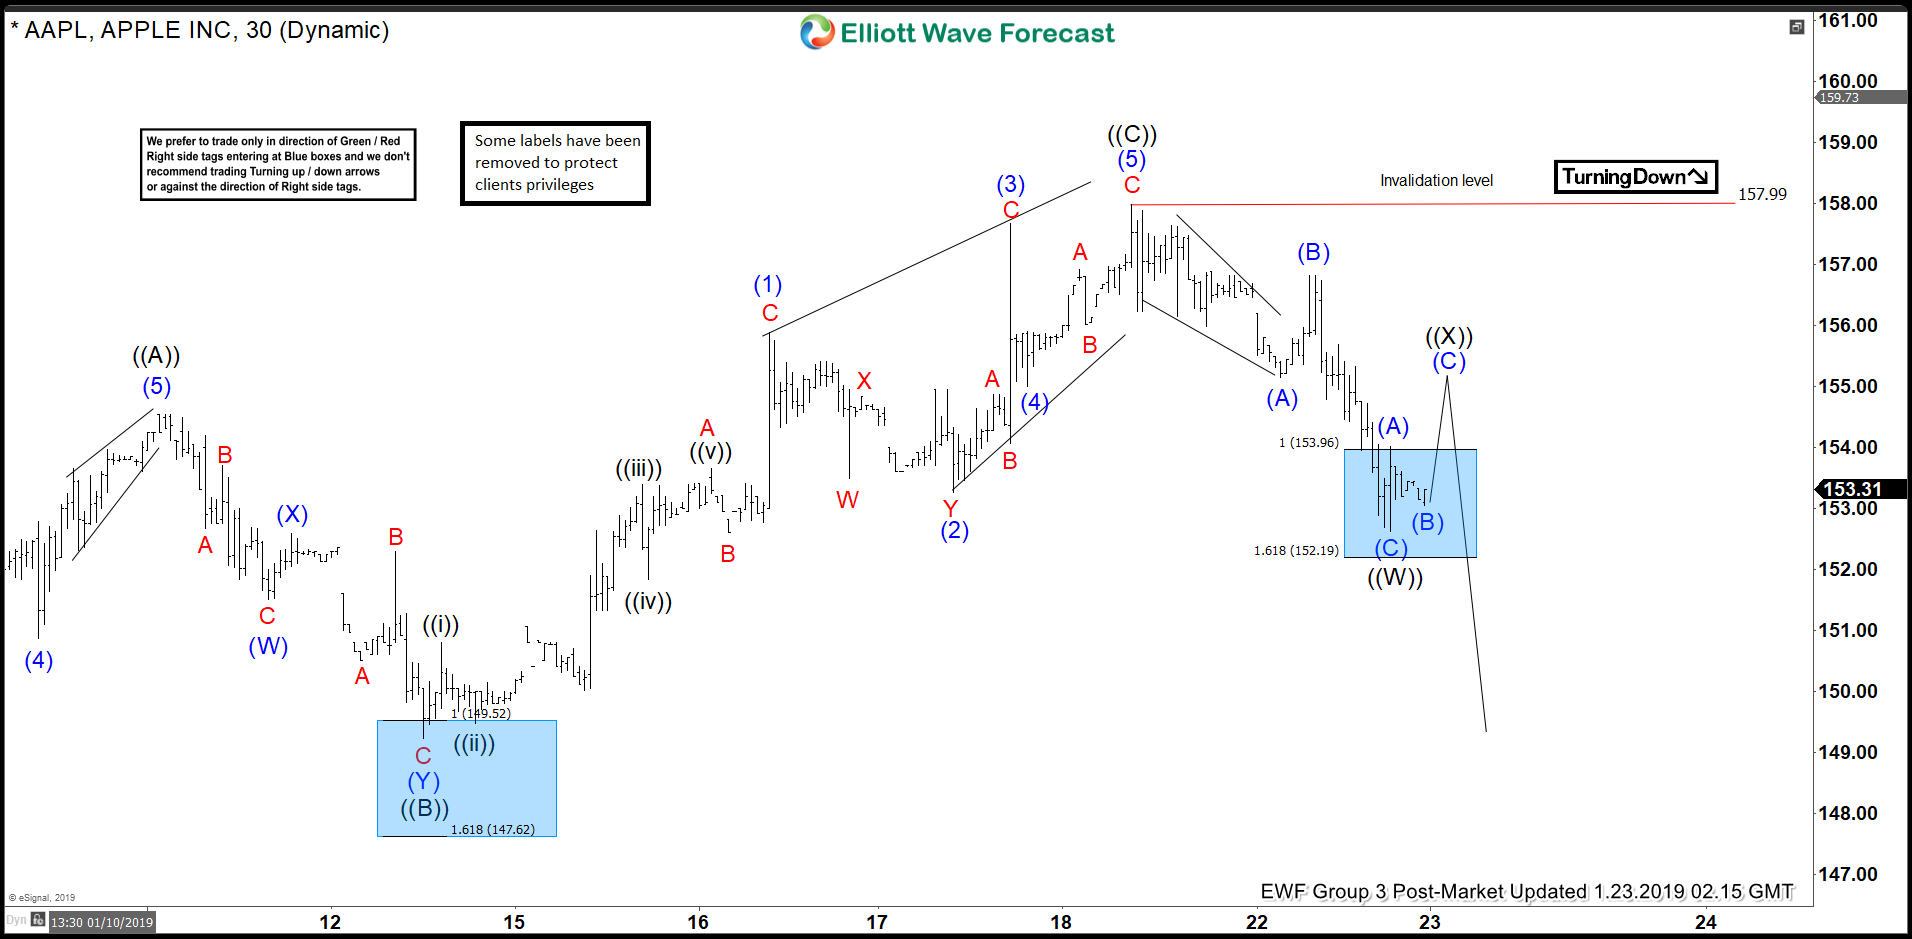
Apple 1 Hour Elliott wave Chart from 1/23/2019 Post-Market update, the stock showing the reaction higher took place from the blue box area as expected for another 5 waves rally. Note that, we have adjusted the degree of the bounce slightly back to primary degree cycle based on our distribution system but the overall structure remained the same. The stock has now completed the cycle from 1/03/2019 low as proposed zigzag structure where primary wave ((C)) is completed at $157.99 high.
Keep in mind that the market is dynamic and the view could change in the meantime. Success in trading requires proper risk and money management as well as an understanding of Elliott Wave theory, cycle analysis, and correlation. We have developed a very good trading strategy that defines the entry. Stop loss and take profit levels with high accuracy and allows you to take a risk-free position, shortly after taking it by protecting your wallet.