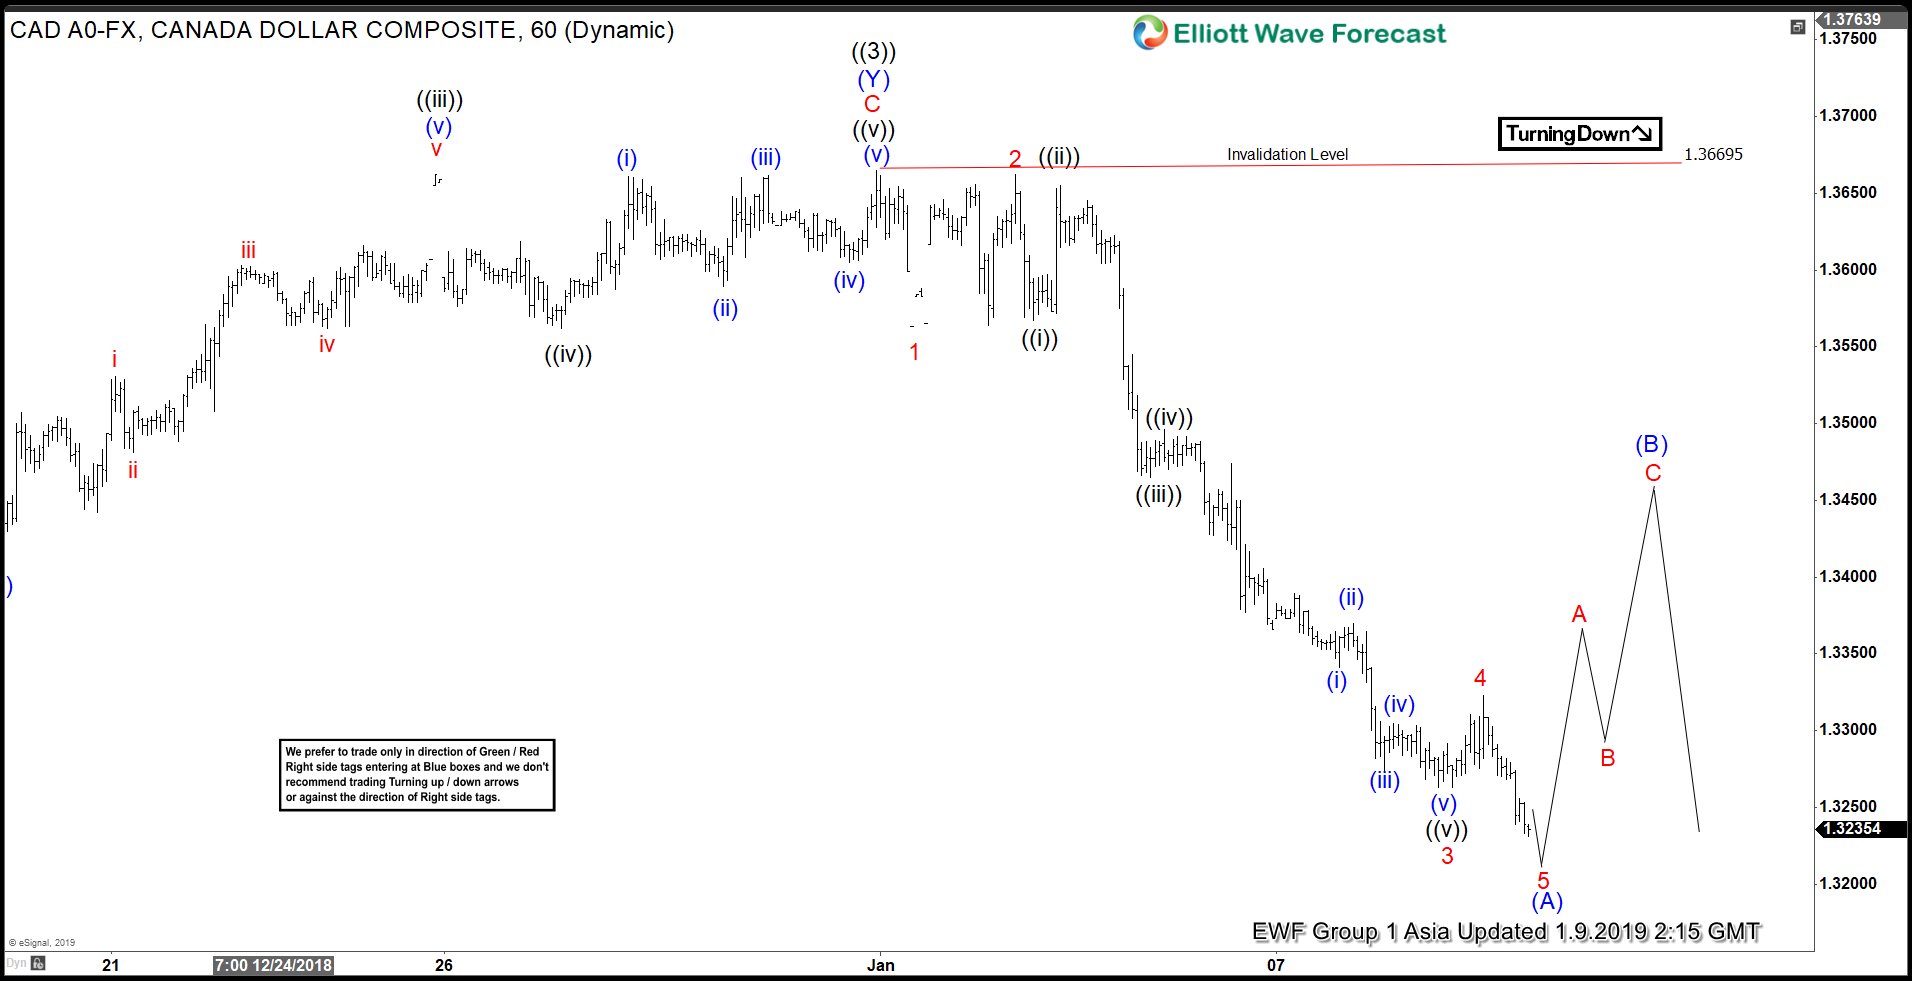
Short term Elliott Wave view in USDCAD shows that the decline from 12/31/2018 high (1.3669) is unfolding as a 5 waves impulse Elliott Wave structure. Down from 1.3669, Wave 1 ended at 1.3563, wave 2 ended at 1.3662, wave 3 ended at 1.3263, and wave 4 ended at 1.3323. We can see a momentum divergence with momentum showing a higher low while price showing a lower low.
This suggests that wave 5 is near complete and we can soon see a 3 waves rally to correct the decline from 12/31/2018 high. To get an estimate on how far the bounce can go, it should ideally end around 50 – 61.8% fibonacci retracement of the decline from 1.3669. This however is more of a guideline and not a rule. The actual rally can be deeper or shallower than the 50 – 61.8% retracement guide. The most important level remains to be 1.3669.
As the move lower from 1.3669 is impulsive, the bounce should fail below 1.3669 and give us at least another 5 waves down to end a zigzag Elliott Wave structure at minimum. The medium term outlook therefore favors further downside although short term we may see a bounce soon.
USDCAD 1 Hour Asia Elliott Wave Chart