
Hello traders. Welcome to a new blog post where we discuss trade setups. In this post, the spotlight will be on TSLA which renewed the bullish trend since the April low. The blog will explain how members went long from this extreme zone and the potential targets area.
Tesla, Inc. (TSLA) is a global leader in electric vehicles and clean energy, known for its innovation in EVs, battery technology, and autonomous driving. The company continues to shape the future of transportation while expanding its footprint in energy storage and solar solutions.
TSLA has been in a clear bullish sequence since its inception, consistently breaking previous highs while maintaining support above prior lows. Within this long-term bullish cycle, which began in June 2010, a new one emerged in April 2025. When a bullish sequence is established, we look to buy dips at the extreme zone of a 3, 7, or 11-swing corrective structure. On October 1st, the stock initiated a pullback to correct the sub-wave from June 2025. By early November, the emerging corrective structure became clear. Upon confirming a 7-swing structure, we shared the extreme zone with members, indicating the likely trade area.
About Elliott Wave 7-swing (Double Zigzag) structure.
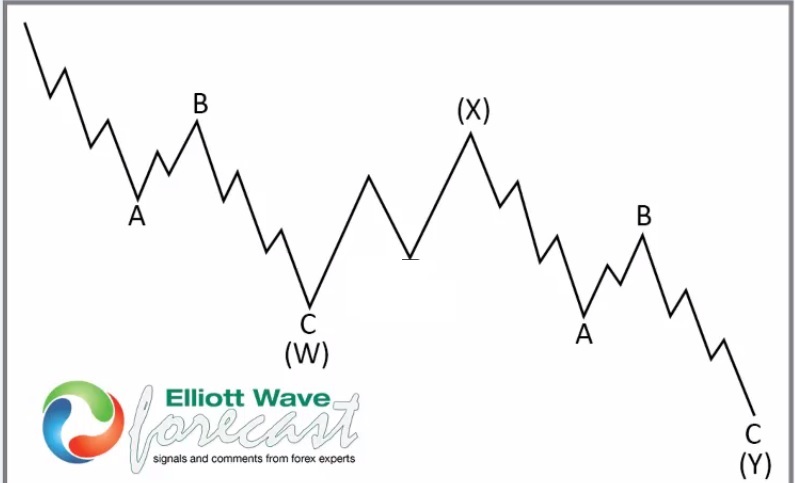
A double zigzag occurs when a single zigzag isn’t sufficient to complete the correction, leading to a combination of two zigzags connected by an intervening wave. It’s labeled as W-X-Y, where:
- Wave W: The first zigzag (5-3-5 structure).
- Wave X: A connector wave, typically a three-wave corrective pattern (like a flat or another smaller zigzag), which links the two zigzags. Wave X often retraces 50% to 61.8% of Wave W.
- Wave Y: The second zigzag (another 5-3-5), usually similar in size and duration to Wave W, though it can be longer in some cases.
This results in an overall 5-3-5-3-5-3-5 (7-swing) structure, making it a seven-wave pattern. Double zigzags are part of the “double three” family in Elliott Wave terminology, which emphasizes their role in complex corrections. They tend to appear in waves 2 & 4 in an impulse and in wave B of a larger correction.
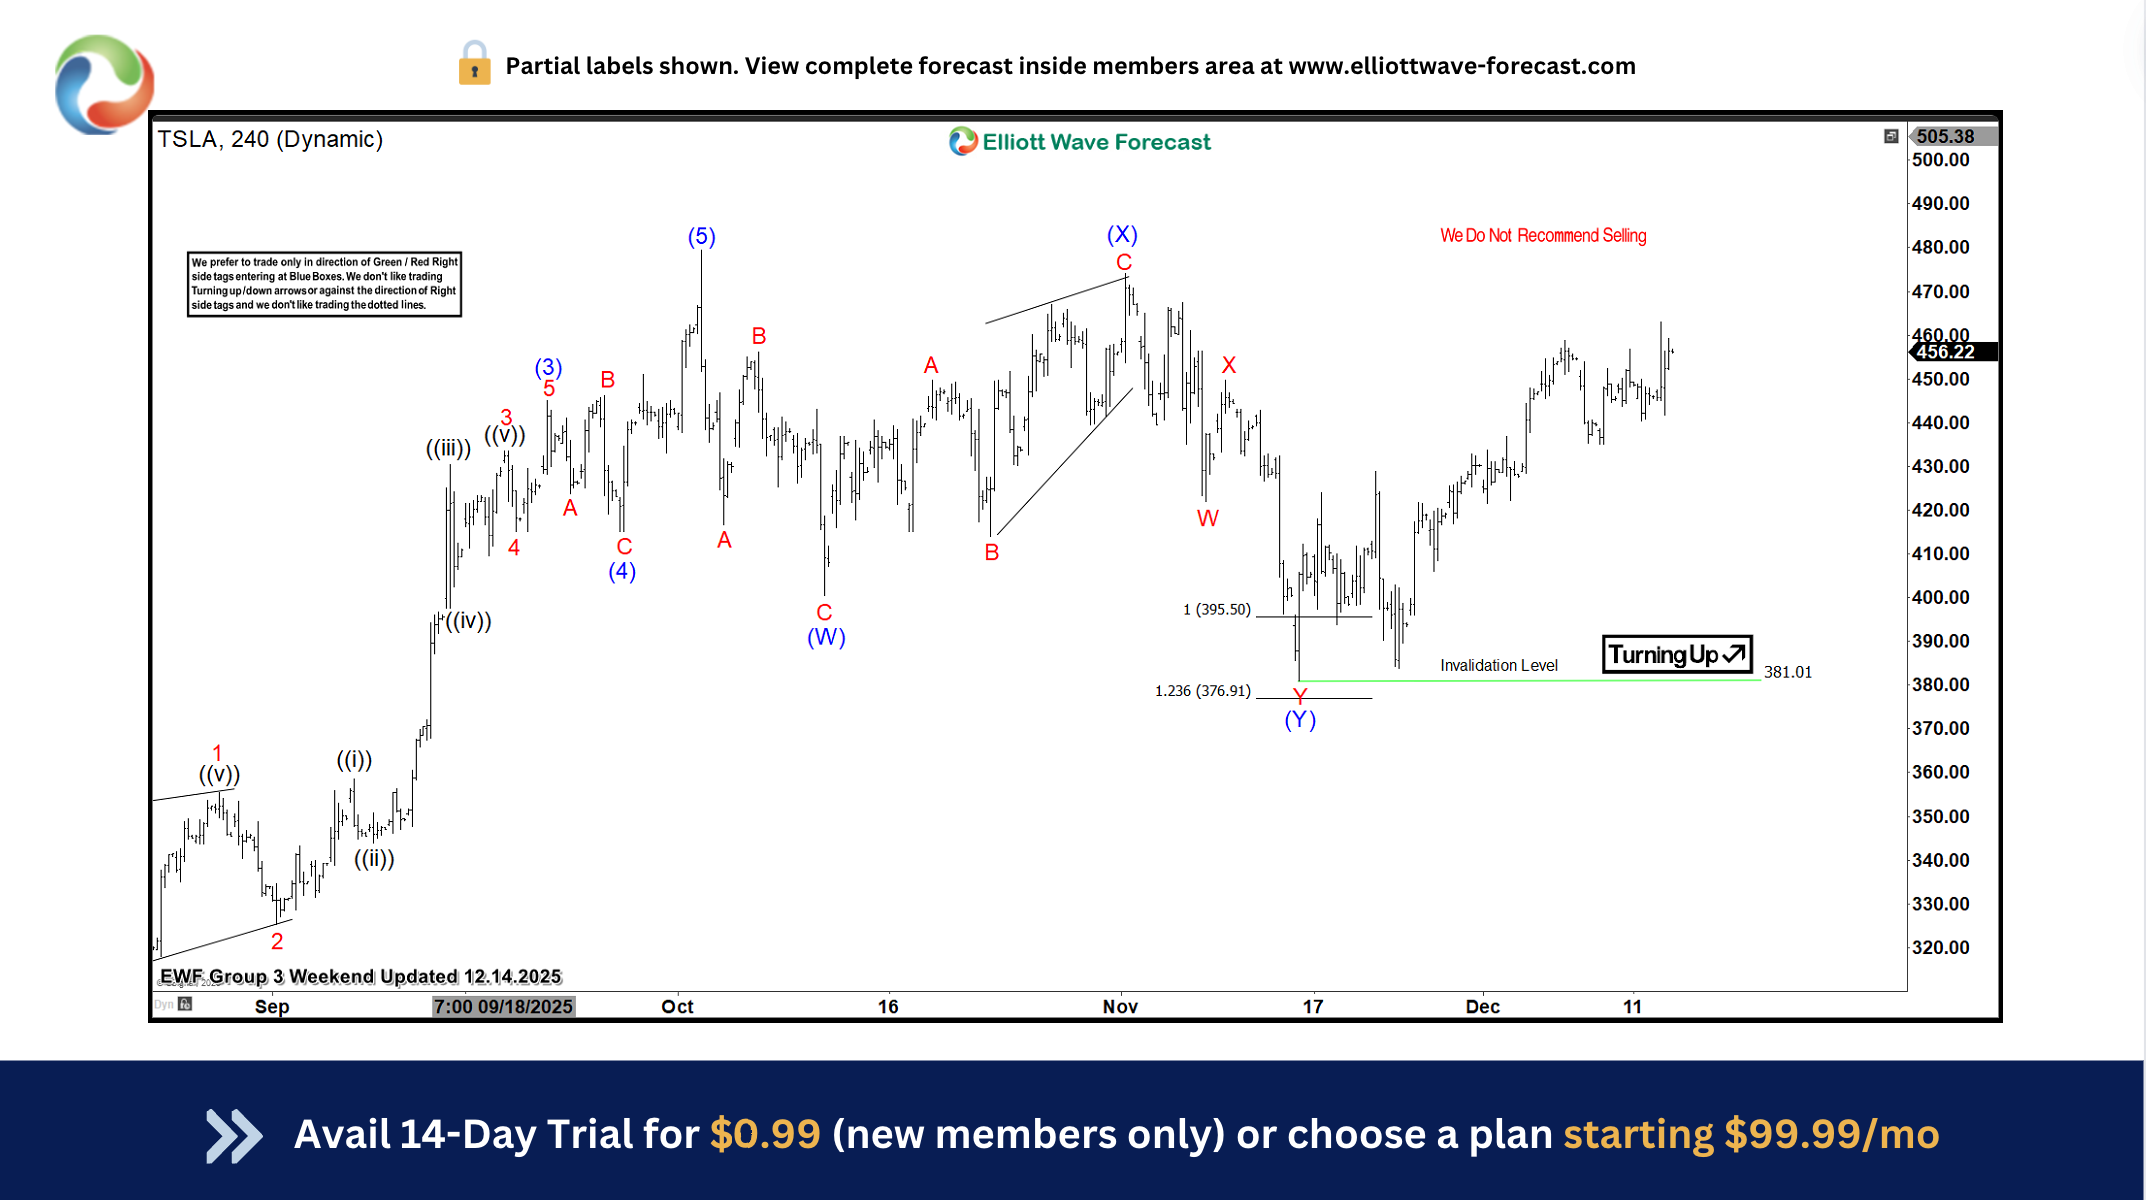
At Elliott wave forecast, we like trading this structure when it appears against the trend. That allows us to find entry at the extreme. We identified this structure on the TSLA H4 chart on 11.13.2025 as the chart below shows.

We identified 395.5-346.80 as the extreme zone where it could attract buyers again.
TSLA Elliott Wave Analysis 12.24.2025
On December 24th, 2025, we shared the chart above with members, demonstrating the stock’s bounce from the extreme zone (buying zone). At the time of writing, TSLA was trading at $477, surpassing its previous high. Therefore, a similar opportunity could arise from the next dip. Before that happens, the stock could reach $512, which is our final profit target for the November setup.
Source: https://elliottwave-forecast.com/stock-market/tsla-nears-500-off-support-zone/