
USDJPY Technical Analysis January 8/2019
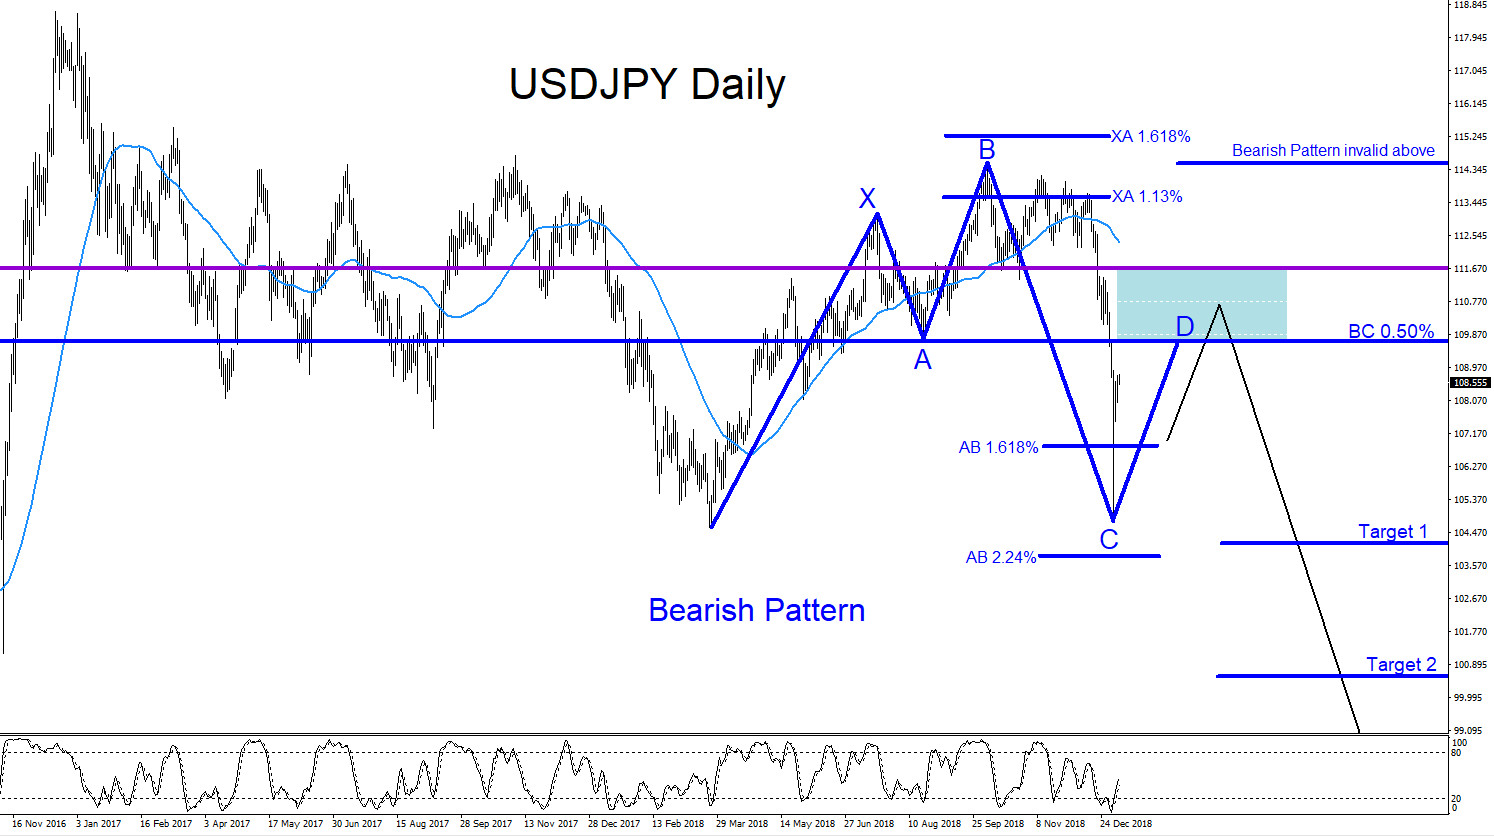
USDJPY remains bearish as long as the October 4/2018 high remains untouched. On the Daily chart there is a clear visible bearish pattern that can be seen. The blue bearish pattern triggers SELLS at the BC 0.50% Fib. retracement level. Price has still not reached this level so traders will need to be patient and see if USDJPY will touch this level and also watch to see if a downside reaction comes from this level. A possible price reaction lower can happen from the BC 0.50% Fib. retracement level or price can continue higher towards the purple trend line level where more bears can possibly be waiting to push USDJPY lower. Both the blue BC 0.50% Fib. retracement and the purple (support/resistance) trend line level are significant because there has been previous support/resistance price action in the past at these levels. Traders will need to wait and watch how price reacts at the possible reversal zone (blue box) and see if the market reacts lower to the bearish pattern or at the purple support/resistance level. If looking to trade USDJPY stops should be placed at the October 4/2018 blue point B high of the blue bearish pattern looking for another move lower to extend below the January 3/2019 lows. Only time will tell what the pair will do but at least now you are aware of the possible area where USDJPY can reverse lower from.
USDJPY Daily Chart 1.8.2019
*** Always use proper risk/money management according to your account size ***
At Elliottwave-Forecast we cover 76 instruments (Forex, Commodities, Indices, Stocks and ETFs) in 4 different timeframes and we offer 5 Live Session Webinars everyday. We do Daily Technical Videos, Elliott Wave Trade Setup Videos and we have a 24 Chat Room. Our clients are always in the loop for the next market move.