
Hecla Mining (HL) has shown strong revenue growth in 2025, climbing to $1.33 billion, up 43% year-over-year, while earnings per share surged to $0.38 from $0.06. This performance highlights the company’s ability to capitalize on favorable silver and gold prices, as well as operational improvements across its mining assets. However, despite these gains, analysts remain cautious: consensus price targets average around $11.14, implying a potential downside from current levels. This disconnect between fundamental growth and market expectations suggests that investors should weigh near-term volatility against long-term production strength.
Looking forward, Hecla is projected to continue expanding revenue to $1.55 billion in 2026, with EPS expected to more than double to $0.79. Transitioning from recent declines, the stock may face pressure as traders reassess valuations, but the company’s improving fundamentals provide a supportive backdrop. Consequently, while the current price action signals weakness, the long-term trajectory remains constructive, especially if commodity markets stabilize. Investors should monitor the $15–$17 range closely, as sustained support here could set the stage for renewed momentum.
September Elliott Wave Outlook: HL 4-Hour Chart
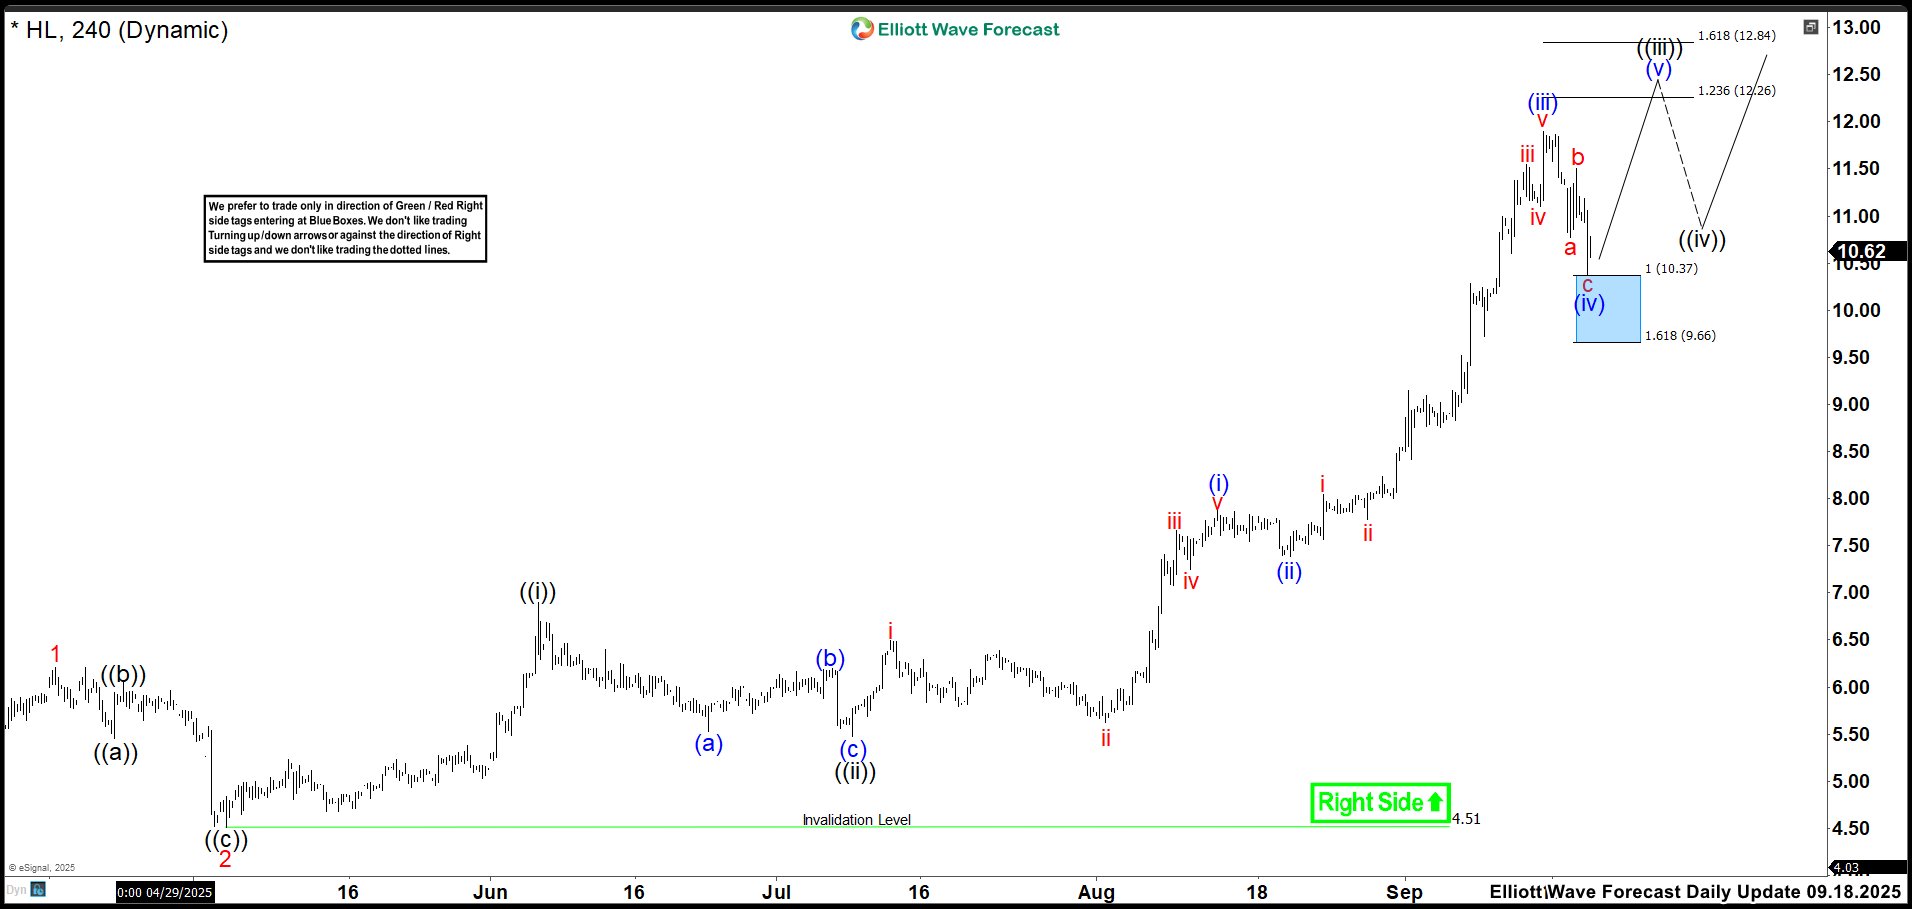
Three months ago, we spotted the first blue box. We bought at 10.37 during wave (iv), and we expected at least a rally toward the zone of 12.26–12.84, unless more bullish extensions appeared.
October Elliott Wave Outlook: HL 4-Hour Chart 2025
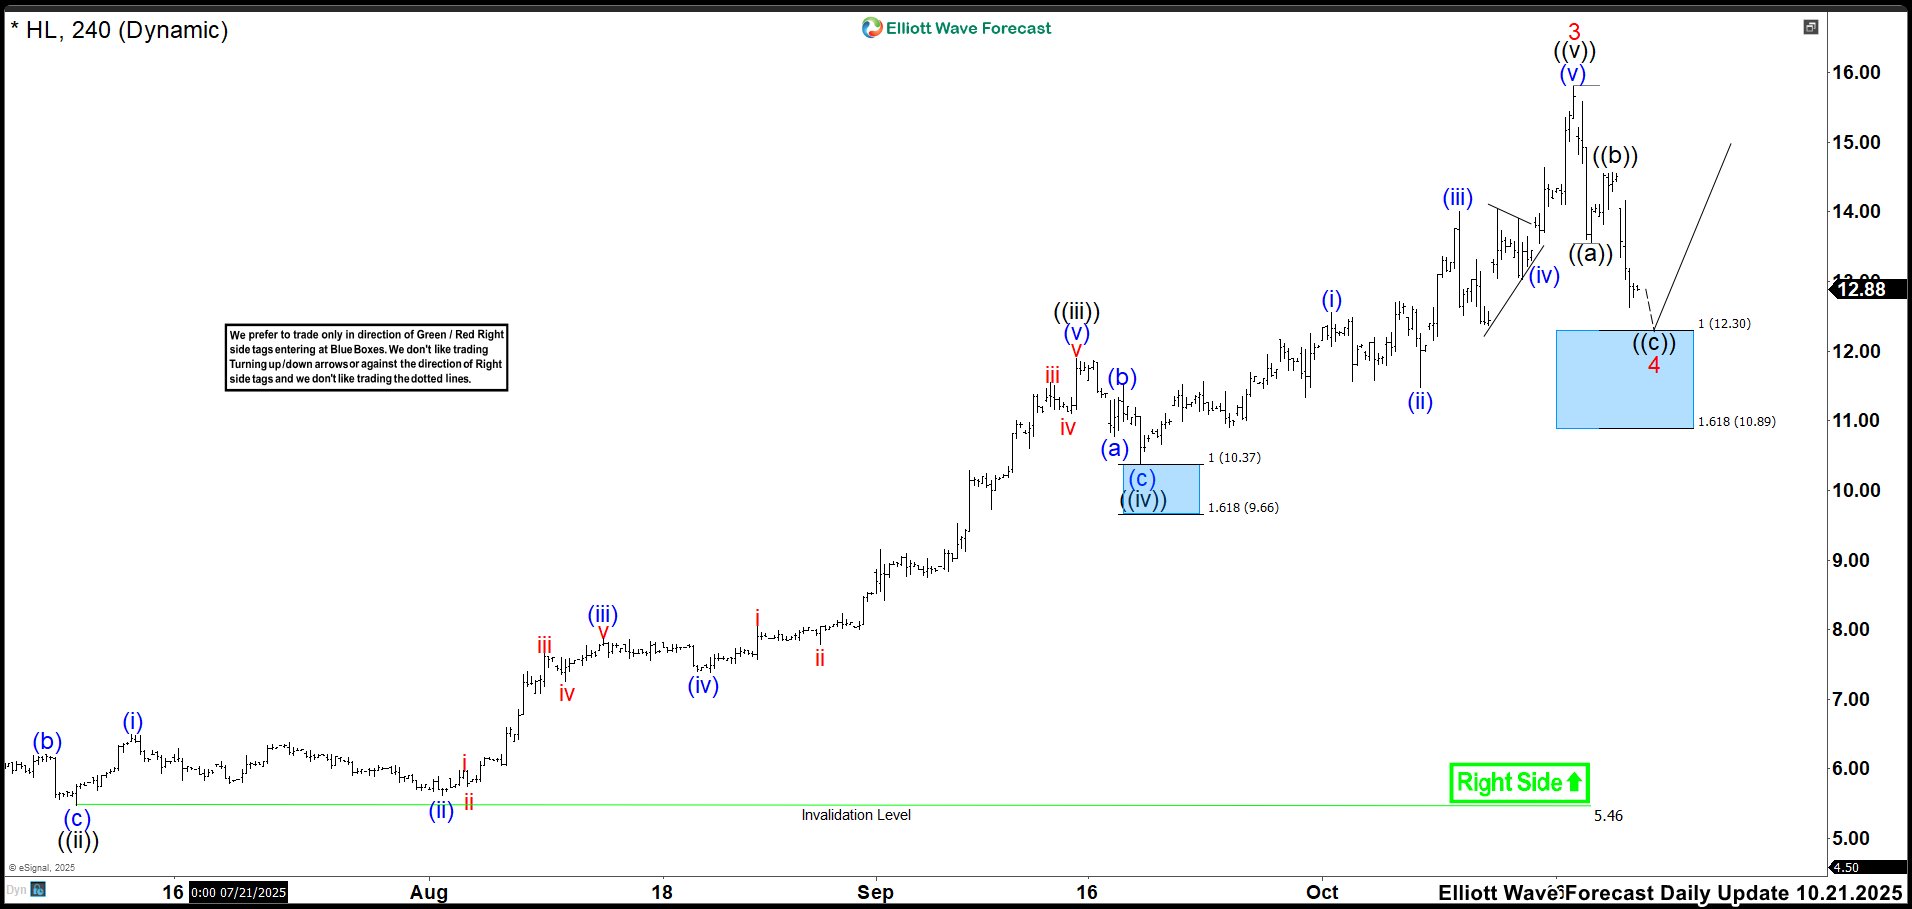
Then, in October, HL showed a strong rally and extended higher. Therefore, we adjusted the count and labeled it as wave ((v)) of 3, which ended above 15 dollars. After that, another correction appeared, and we looked to continue the bullish trend. As a result, we called for buying opportunities in the zone of 12.30–10.89 to complete wave 4 and move upward as wave 5, aiming to break the high of wave 3.
November Elliott Wave Outlook: HL 4-Hour Chart 2025
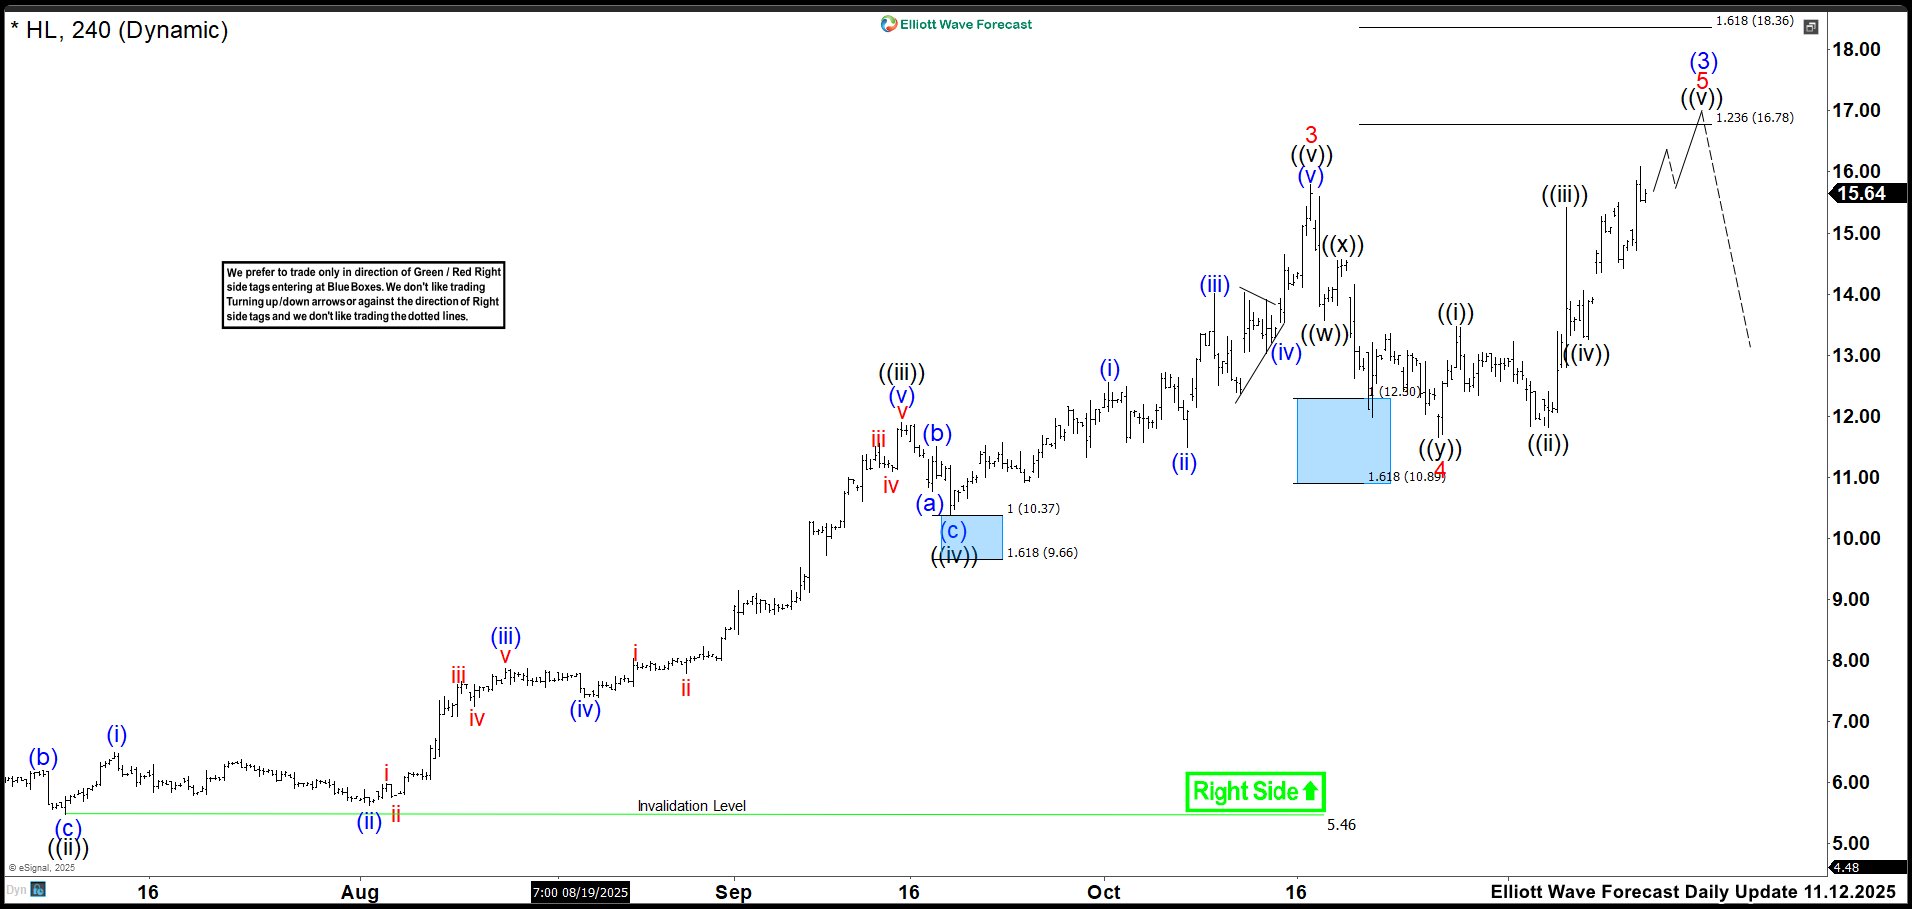
Next, in November, the correction respected the blue box once again. Wave 4 was completed, and the rally continued as we had expected. At that point, we aimed for a target of 16.78 to finish wave 5, and also wave (3), before another correction was seen in the market.
December Elliott Wave Outlook: HL 4-Hour Chart 2025

In December, HL’s price made a small high without reaching the ideal zone. Wave (3) was completed at 16.14, and another correction started. You may wonder what happened with that correction, did we buy again?
(If you want to learn more about Elliott Wave Principle, please follow these links: Elliott Wave Education and Elliott Wave Theory.)
November Elliott Wave Outlook: HL 1-Hour Chart 2025
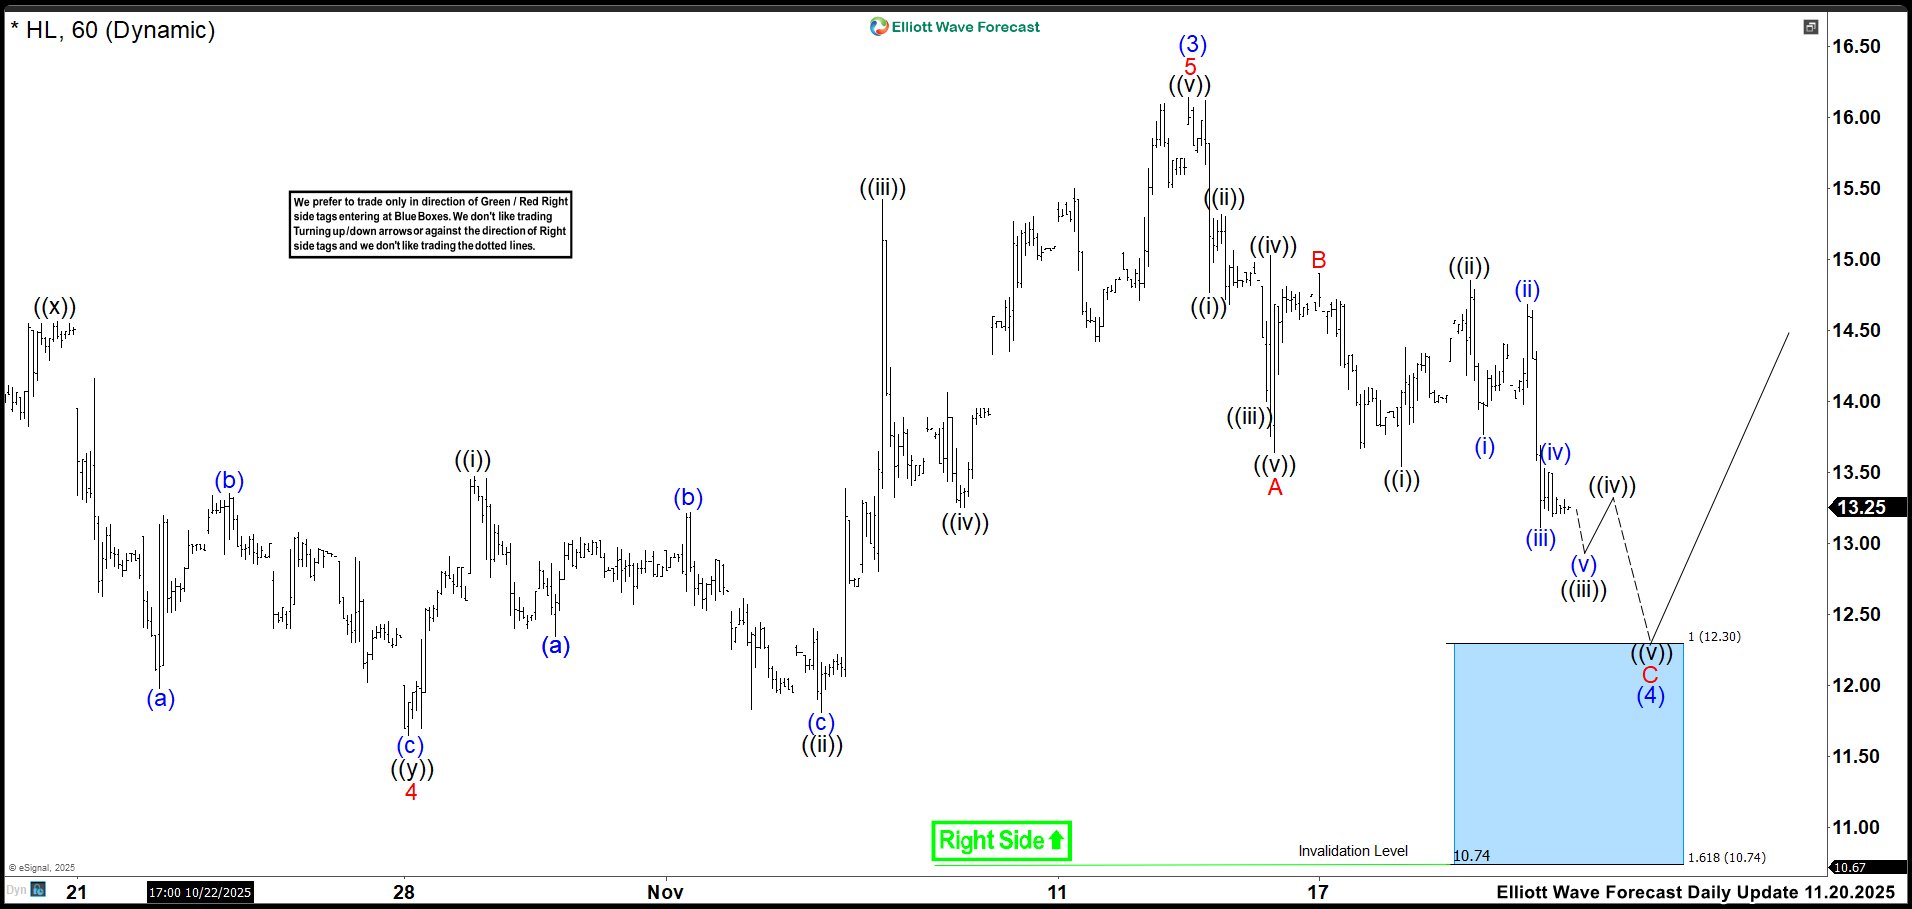
On the one-hour chart, we called for buying opportunities in the zone of 12.30–10.74. This move was intended to finish the correction of wave (4) and aim for another breakout toward new highs as wave (5)
December Elliott Wave Outlook: HL 1-Hour Chart 2025
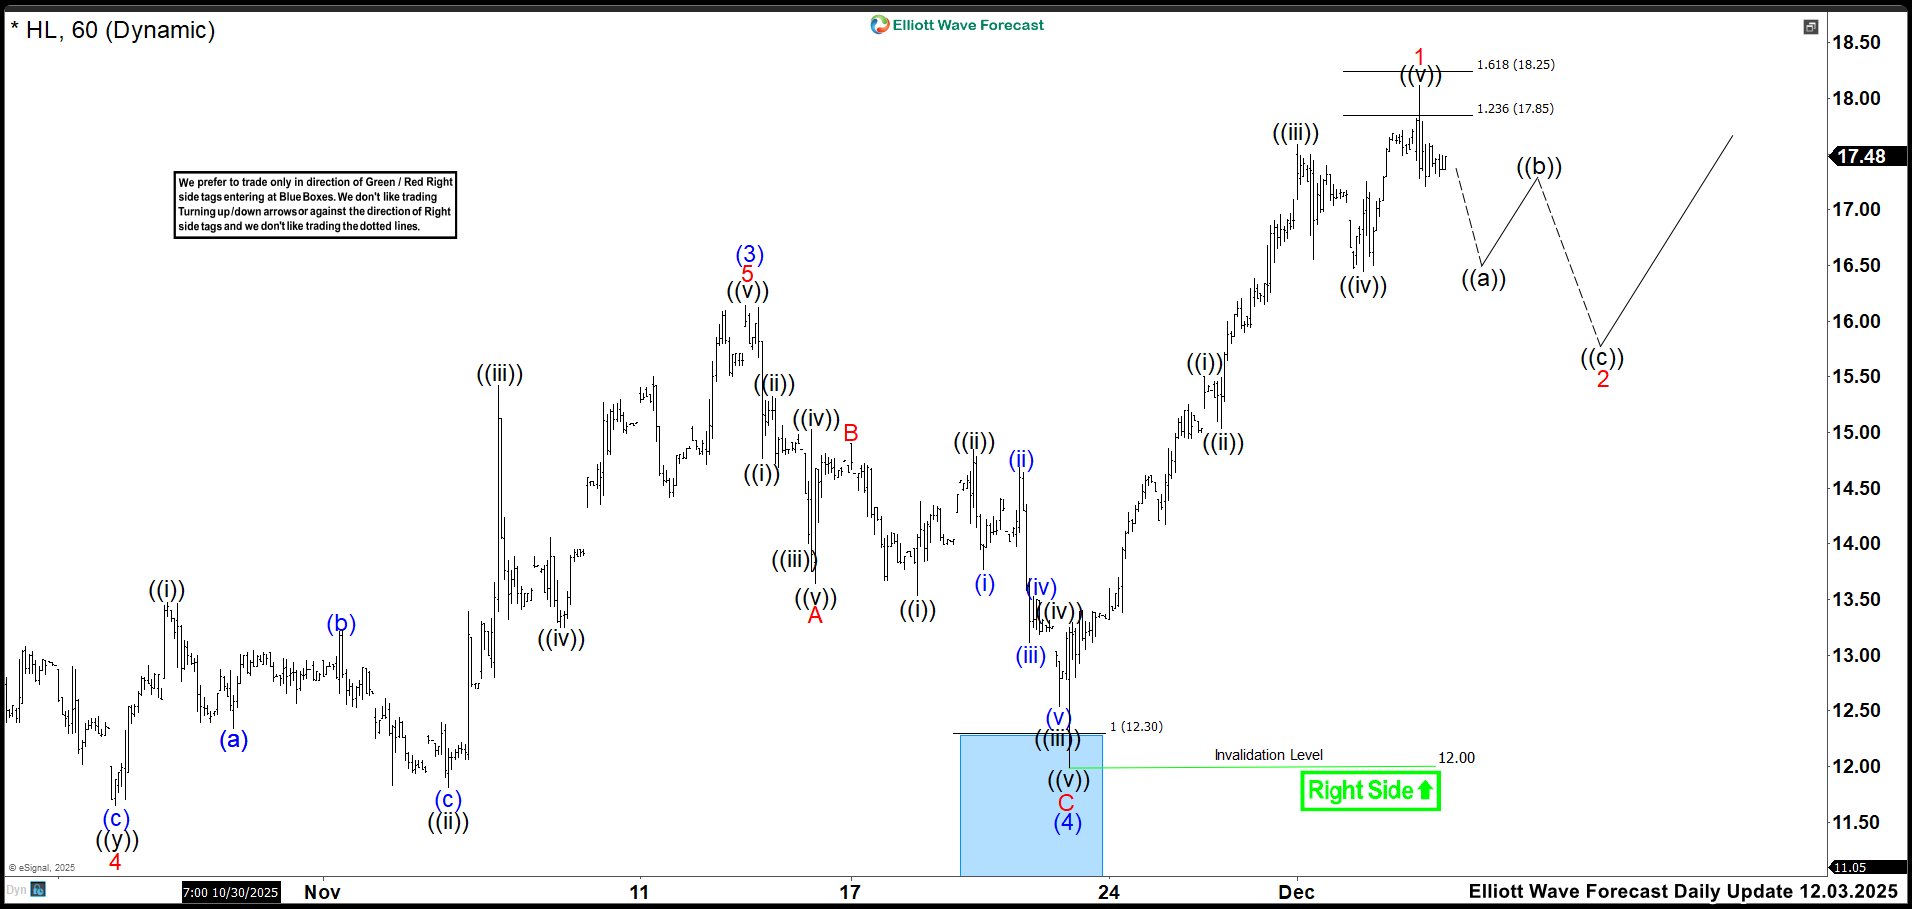
Finally, the market respected the blue box once more. Wave (4) was completed at 12.00, and a strong rally followed, reaching the zone of 17.85–18.25 before another correction began. At present, HL’s price is around 18.88, and further bullish movement is expected.
This sequence shows that trading can be done by respecting a system, without operating every day. We executed only three trades in 3 months, and for those holding positions, the result has been highly profitable. You only need a system, and you must respect it. Whether you win or lose, you must keep moving forward. In the end, discipline is required just as in every aspect of life.
Source: https://elliottwave-forecast.com/stock-market/surfing-waves-blue-box-hl-hecla-mining/