STRTECH (Sterlite Technologies): Elliott Wave FLAT Structure
Sterlite Technologies Ltd. Sterlite Technologies Limited designs, builds and manages “smarter networks” Sterlite Tech develops & delivers optical communication products, network & system integration services and software solutions for telecoms globally. The company is listed on the Bombay Stock Exchange and the National Stock Exchange of India. The company changed its name to Technologies Limited’ from Dec.2006. It is India’s only integrated Optical Fiber producer and one of the largest suppliers of Optical Fibers to overseas markets in China, Europe and South East Asia.
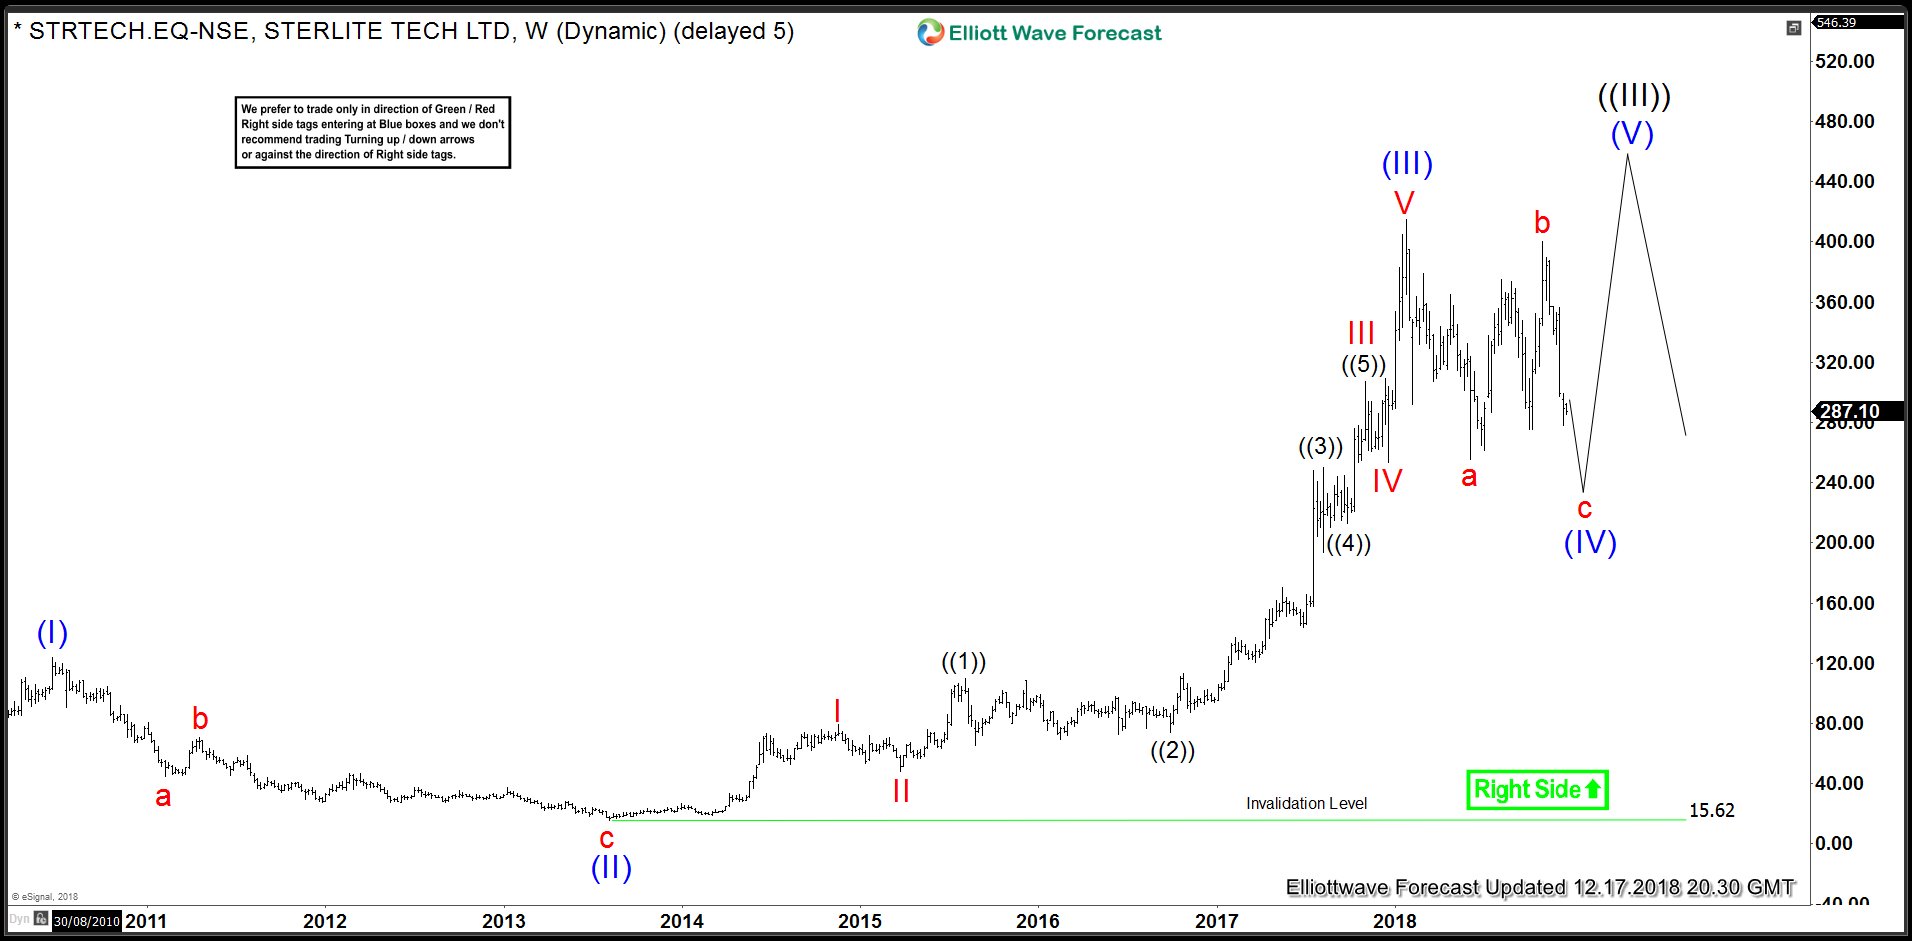
STRTECH Weekly Elliott Wave Analysis
STRTECH rally from 2013 low was a 5 waves impulse and completed at 415 (1/24/2018). It is 323.6% Fibonacci extension of wave (I) related to wave (II) due to which we have labelled it as wave (III) of a grand super cycle from all time low. Current sell off in the stock is part of a wave (IV) correction which is unfolding as a FLAT Elliott wave correction. Once completed, expect the stock to resume the rally for a new high above 415 (1/24/2018) peak or produce a 3 waves bounce at least. Let’s take a look at this proposed FLAT correction in the daily chart and where it is likely to end.
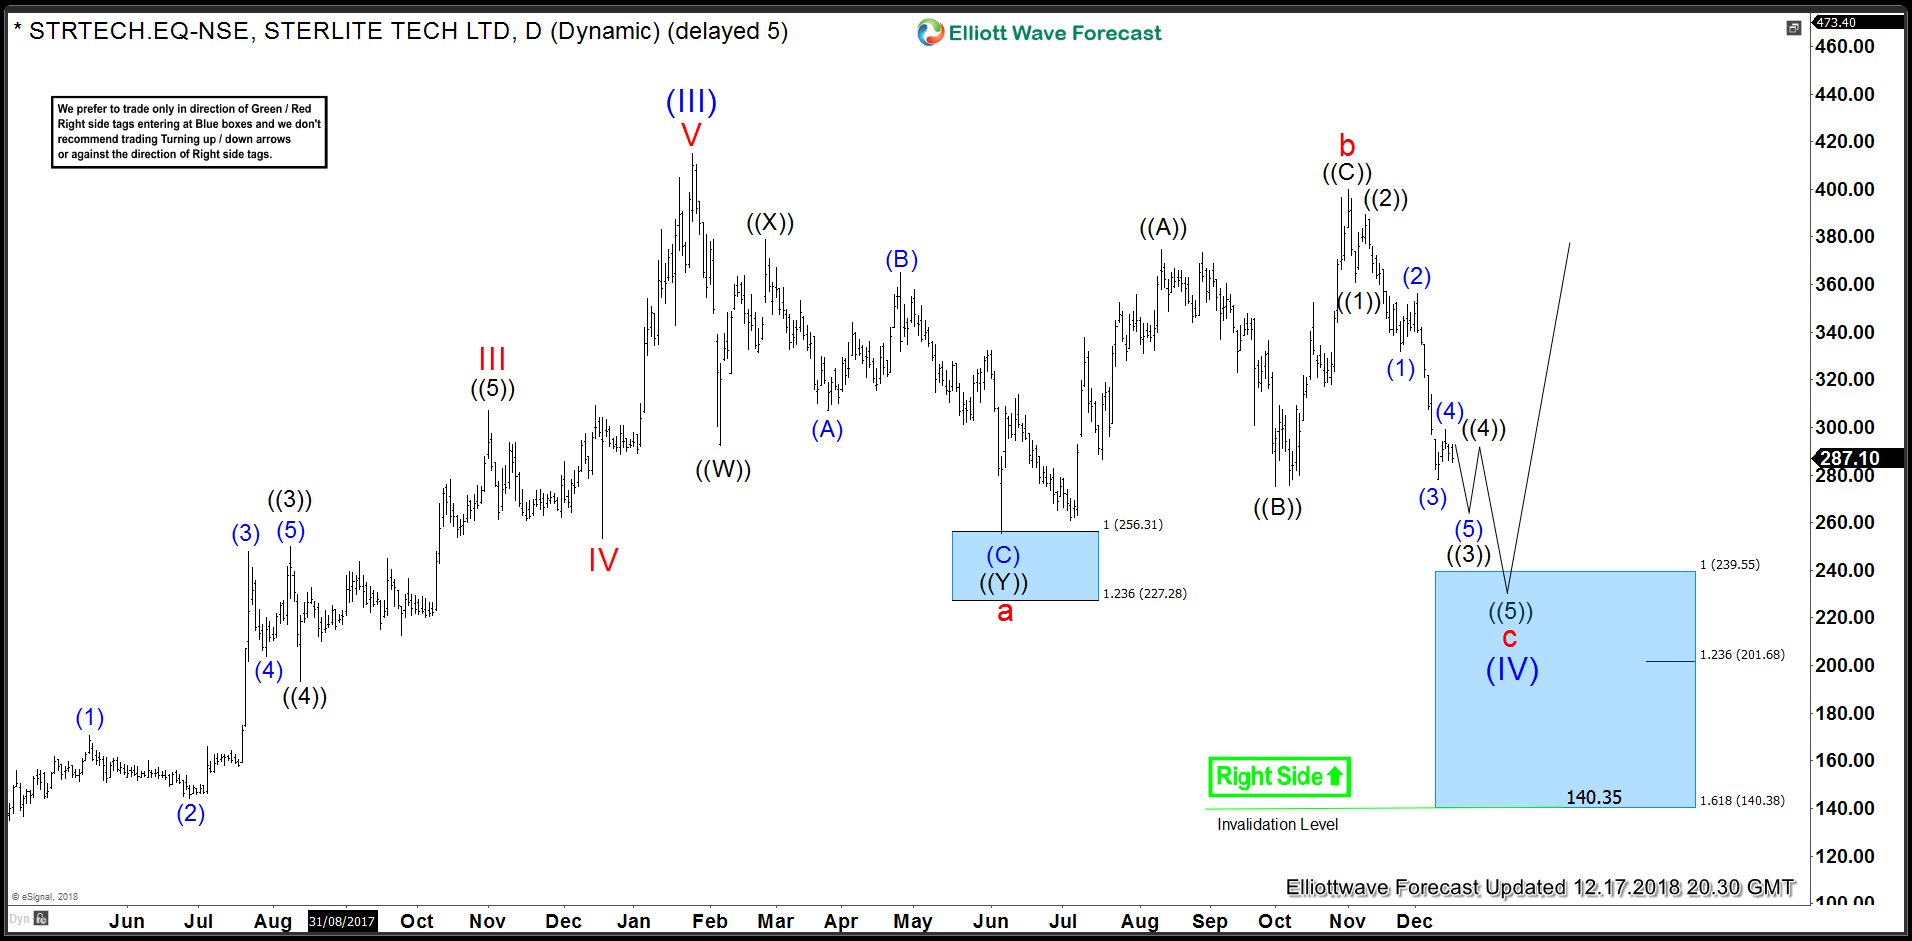
STRTECH Elliott Wave FLAT Correction
STRTECH initial decline from 1/24/2018 (415) peak was a double three Elliott wave structure i.e. ((W))-((X))-((Y)) and was expected to complete between 256.31 – 227.28 which is 100 – 123.6% Fibonacci extension area of ((W)) related to ((X)). We highlighted this area with a blue box and it ended right at top of the blue box resulting in a bounce to 400 area. However, it was not enough to take prices to new highs, sellers entered the market again and pushed prices sharply lower. Decline from wave “b” high (400) appears to be impulsive which makes case for a FLAT correction down from 1/24/2018 peak. A FLAT is a 3-3-5 structure in which first leg is in 3 waves, 2nd leg is in 3 waves and 3rd leg is in 5 waves which could be a regular Elliott wave impulse or a diagonal structure. In this case 3rd leg is unfolding as an impulse when we think it has either finished wave (4) of ((3)) or will make another high to finish wave (4) of ((3)). In either case, as far as price stays below 317.41 which is 50% Fibonacci retracement of wave (3), expect STRTECH to see more downside toward 239.55 -201.68 area to complete wave “c” and an Elliott wave FLAT in wave (IV). Like we saw the stock finding buyers in the blue box between 256.31 – 227.28, similarly, we are expecting buyers to appear again in the next blue box between 239.55 – 201.68 and in extension 140.38 and then resume the rally for a new high above 1/25/2018 (415) or produce a larger 3 waves bounce at least.