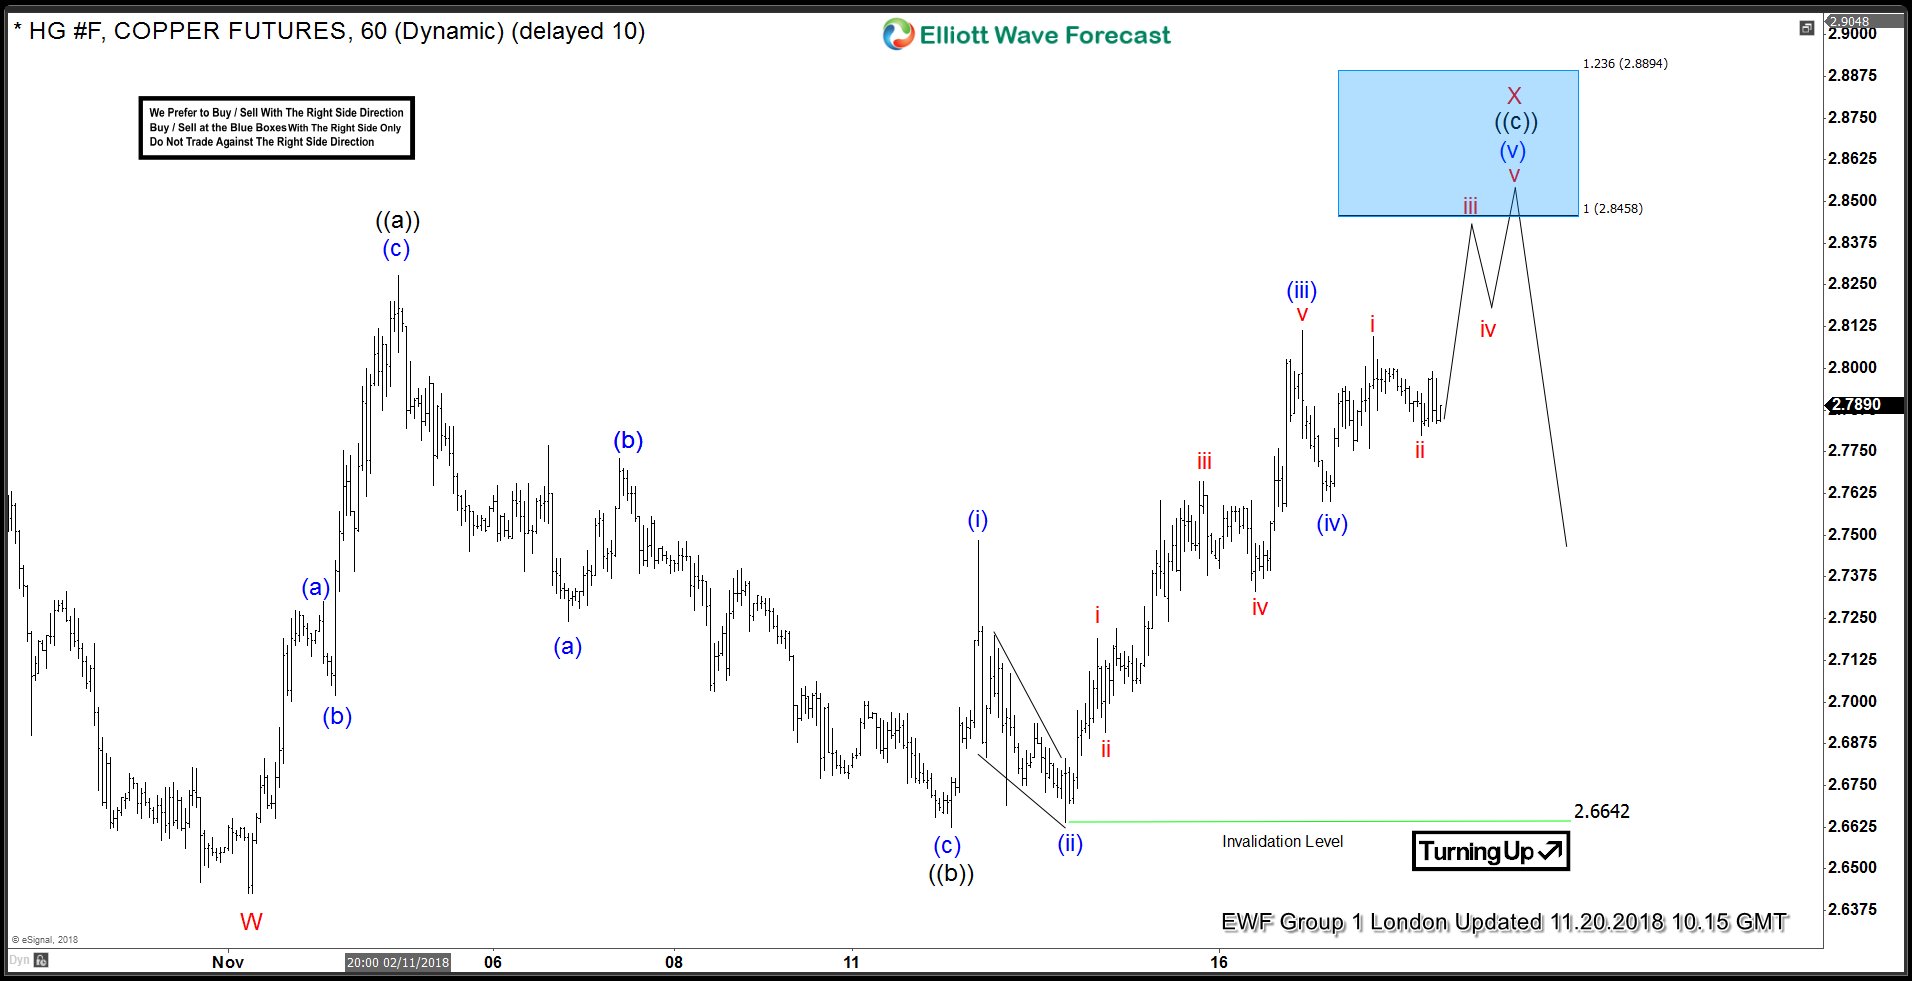
In this blog, I want to share some short-term Elliott Wave charts of Copper which we presented to our members in the past. Below, you see the 1-hour updated chart presented to our clients on the 10/20/18 indicating that Copper ended the cycle from 09/21/18 peak in red wave W at 11/01/18 low (2.6435).
As Copper ended the cycle from 09/21/18 peak, we expected a bounce to occur in red wave X. Above from that low 11/01/18 low (2.6435), the bounce unfolded in an Elliott Wave flat structure. We advised members that Copper ideally should continue lower. Therefore, we expected sellers to appear in the sequences of 3, 7 or 11 swings. At the 100 – 1.236 Fibonacci extension of black ((a))-((b)) which came at around 2.8458-2.8894 area and that was the first area for sellers to appear.
Copper 11.20.2018 1 Hour Chart Elliott Wave Analysis
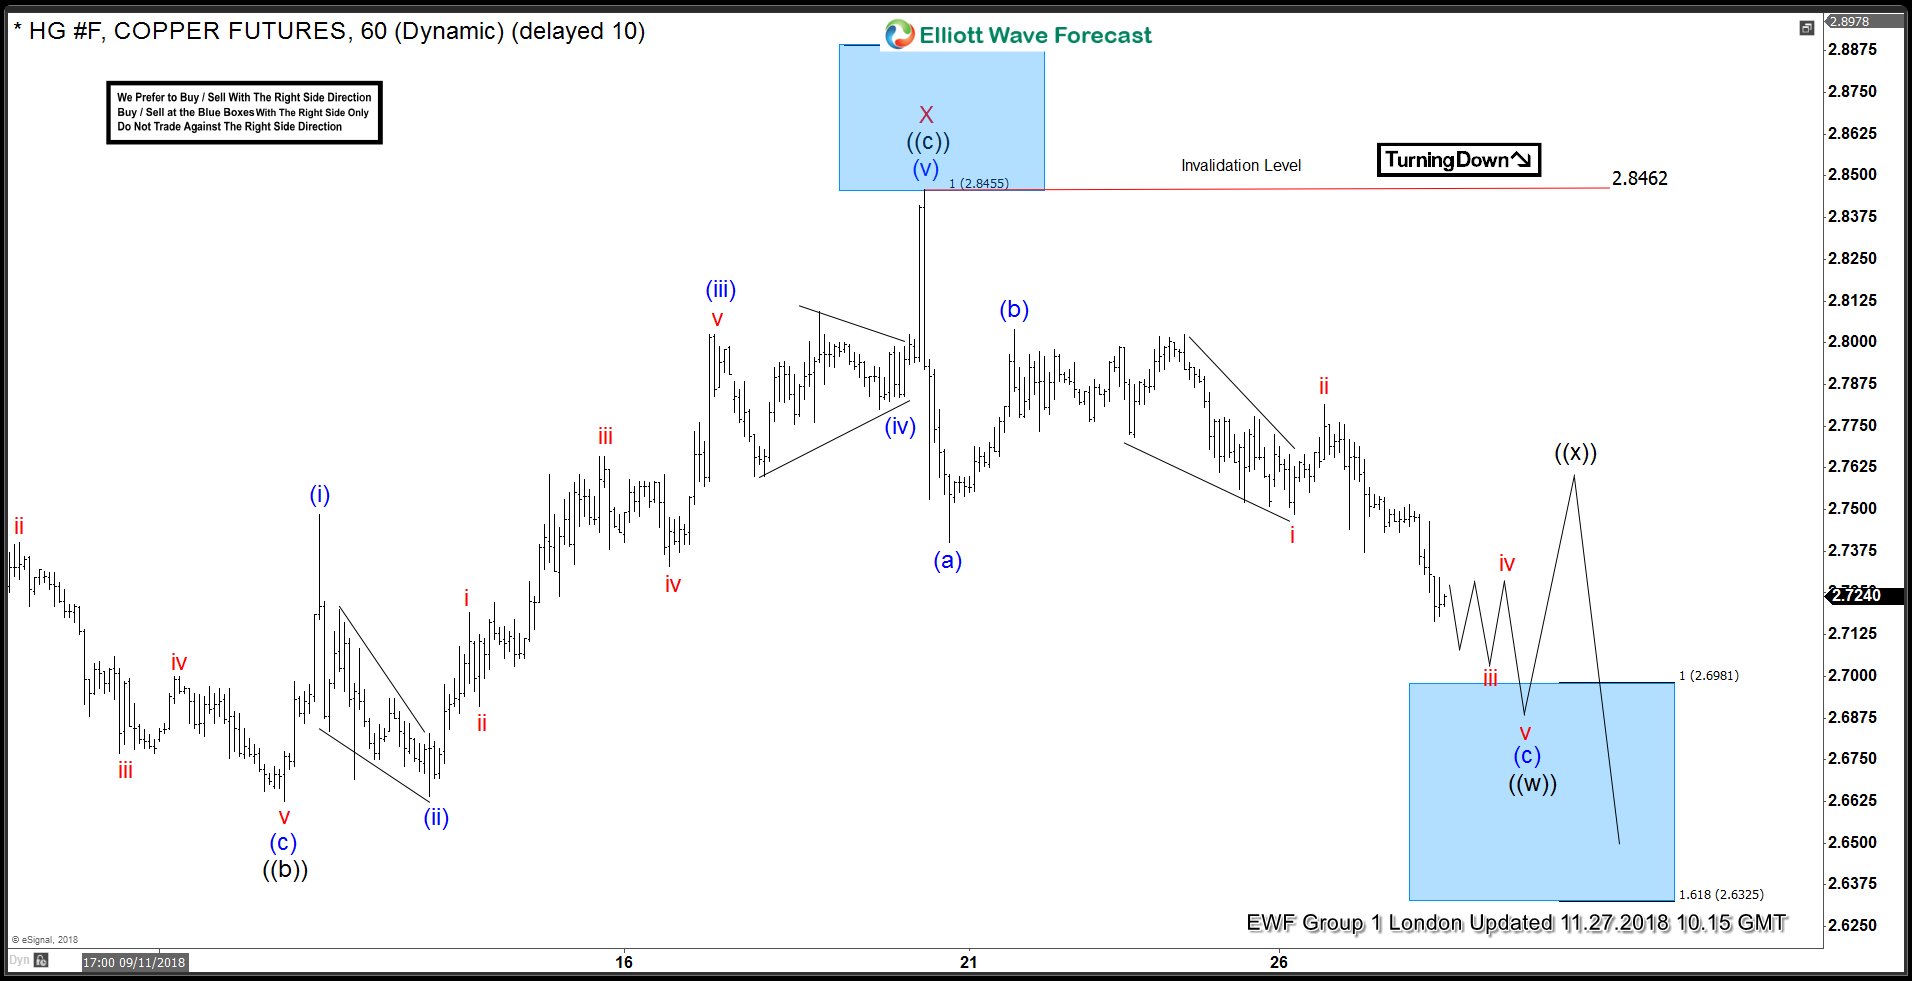
In the last Elliott Wave chart, you can see that the metal reached the blue box area (2.8458-2.8894) and reacted lower and also is close took price below red wave W low. If traded our blue box area shown in the chart above. Then, any trades from that area were risk-free, which means the stop-loss should be moved to break even, targeting lower levels. Do please keep in mind that the 1-hour chart which I presented may have changed already. This blog should just illustrate how accurate our blue boxes are, and how our members trade our 3-7 or 11 swings strategy.
Copper 11.27.2018 1 Hour Chart Elliott Wave Analysis