
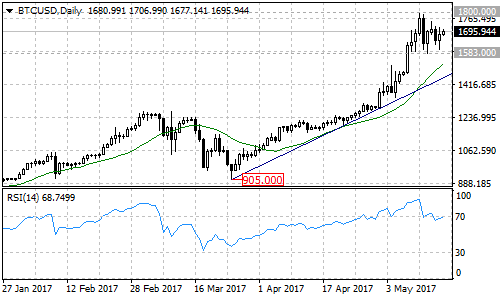
BTCUSD stays above a rising trend line on daily chart, indicating that the pair remains in uptrend from 905. As long as the pair is above the trend line the fall from 1800 could be treated as consolidation of the uptrend. However, the 14 Relative Strength Index is in overbought region, suggesting that the consolidation may continue in the coming days.
Trading range of the consolidation
Sideways movement in a range between 1500 and 1800 would likely be seen over the next several days until the Relative Strength Index is back to 50 area. There is an ascending trend line with support around 1450 on the daily chart. Rebound could be seen when approaching the trend line support.
Breaking above 1800 resistance
Near term resistance is at 1800, a break of this level will indicate that the bullish movement has resumed, and this will trigger another strong move towards 2000 major psychological mark.
The key support
The key support is located at the rising trend line on daily chart, now at 1450. The Bitcoin remains in bullish structure as long as it is above the trend line. On the downside, a clear break below the trend line support will confirm that the bullish movement from 905 had completed at 1800 already, then the following pullback could bring price back to 1300 zone.
Technical levels
Support levels: 1583 (May 13 low), 1523 (20 Moving Average), 1450 (the rising trend line on daily chart).
Resistance levels: 1800 (May 11 high), 2000 (the major psychological mark).