
The AUDUSD pair ran in a falling price channel on the daily chart. Price just bounced off the top trend line of the channel, indicating that the pair remains in the downtrend from 0.8124.
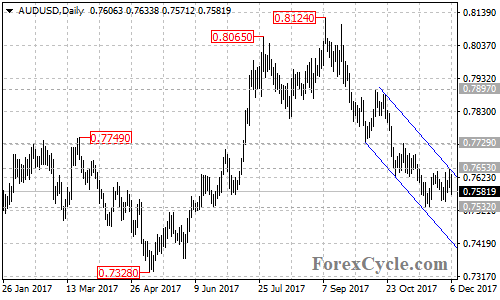
On the downside
Further decline would likely be seen in a couple of weeks and a breakdown below 0.7532 support could take price to next support level at 0.7475 which is the 50% retracement taken from 0.6826 to 0.8124. Below this level could trigger further downside movement towards 0.7328 key support.
A breakdown below 0.7328 support will suggest that the whole upside movement from 0.6826 had completed at 0.8124 already, then the following downside movement could take price to next support level at 0.7144, Below this level would aim 0.6826.
On the upside
Near term resistance is at 0.7653, only break above this level could bring price back to test next resistance level at 0.7729. Above this level will confirm that the downtrend from 0.8124 had completed at 0.7532 already, then further rally towards 0.7897 resistance could be seen.
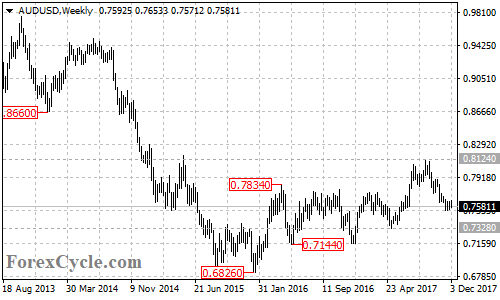
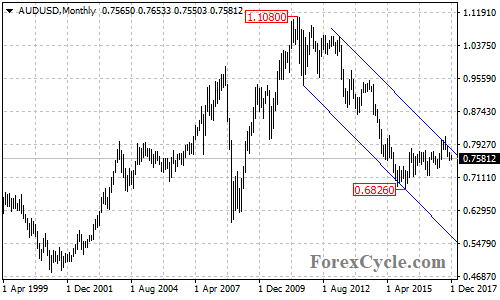
For long term analysis, the AUDUSD pair stays in a bearish price channel on its monthly chart. The price action from 0.6826 is likely consolidation of the downtrend from 1.1080. A breakdown below 0.6826 support could signal resumption of the long term downtrend, then next target would be at 0.6000 psychological level.
Technical levels
Support levels: 0.7532, 0.7475, 0.7328, 0.7144, 0.6826, 0.6000.
Resistance levels: 0.7653, 0.7729, 0.8124.