
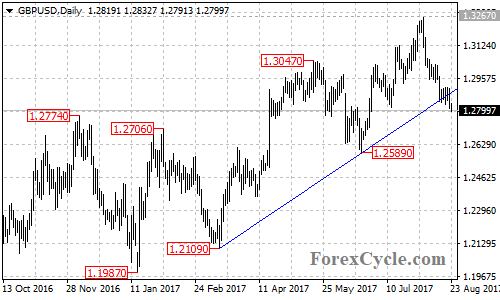
GBPUSD Broke below a major bullish trend line from 1.2109 to 1.2589 on its daily chart. Further decline would likely be ween over the next several days.
On the downside
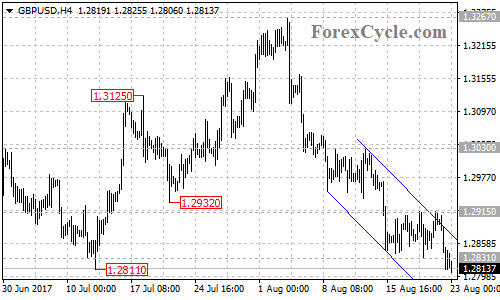
The GBPUSD pair stays in a bearish price channel with resistance at the top trend line now at around 1.2865 on the 4-hour chart. As long as the price is in the channel, the downside movement from 1.3267 could be expected to continue and next target would be at the 76.4% Fibonacci retracement taken from 1.2589 to 1.3267 at around 1.2750, followed by 1.2589.
The 1.2589 level is acting as the key support for the upside movement from 1.1987, a breakdown below this level will confirm that the uptrend had completed at 1.3267 already, then further decline to test 1.1946 support could be seen.
On the upside
As long as 1.2589 key support holds, the fall from 1.3267 would possibly be consolidation of the uptrend from 1.1987, another rise towards 1.3700 is still possible after the consolidation. Near term resistance is at 1.2915, followed by 1.3030, above these levels could signal resumption of the uptrend.
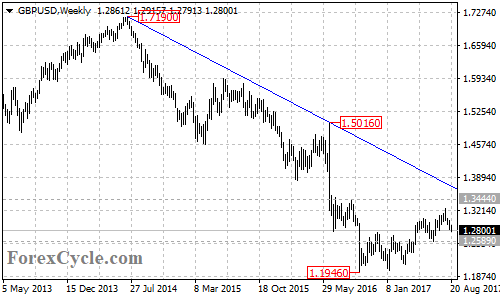
There is a long term bearish trend line from 1.7190 to 1.5016 on the weekly chart, now at around 1.3700. This would be the final target of the upside movement from 1.1946.
Technical levels
Support levels: 1.2750 (the 76.4% Fibonacci retracement), 1.2589 (the June 21 low, key support), 1.2109 (the March 14 low), 1.1946 (the October 2016 low).
Resistance levels: 1.2865, 1.2915 and 1.3030 (near term resistance), 1.3267 (the August 3 high), 1.3444 (the September 2016 high), 1.3700 (the trend line on the weekly chart).