
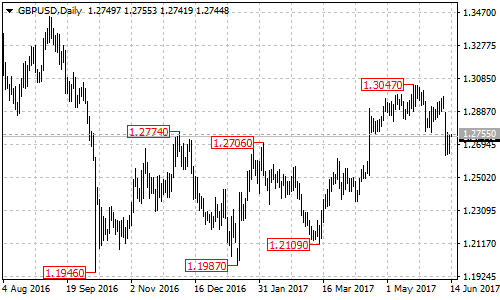
GBPUSD recently broke below 1.2755 support on its daily chart, indicating that the short term bullish movement from the March 14 low of 1.2109 had completed at the May 18 high of 1.3047 already. Further decline would likely be seen over the next several weeks.
On the downside
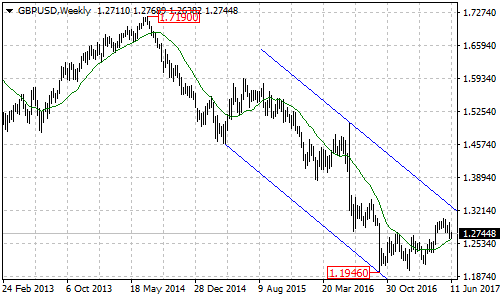
GBPUSD is now facing the support of the 20-week moving average at around 1.2600. If this level gives way, the pair could be expected to find the second support level round the 61.8% Fibonacci retracement, taken from 1.2109 to 1.3047 at 1.2467. A break through this level could take price to the third support level at 1.2109 which acts as the key support for the GBP, below this level will suggest that the long term downtrend from the July 2014 high at 1.7190 has resumed, then the following bearish movement could bring price into 1.1000 zone.
On the upside
As long as the pair is above the 20-week moving average, the uptrend from the October 2016 low of 1.1946 is possible to resume, and one more rise to the top trend line of the price channel on its weekly chart to complete the upward movement is still possible. Near term resistance is at 1.2850, a break of this level could signal resumption of the uptrend.
Technical levels
Support levels: 1.2600 (20-week moving average), 1.2467 (61.8% Fibonacci retracement), 1.2109 (March 14 low, key support), 1.1946 (October 2016 low).
Resistance levels: 1.2850 (near term resistance), 1.3047 (May 18 high), 1.3280 (the top trend line of the price channel on weekly chart).