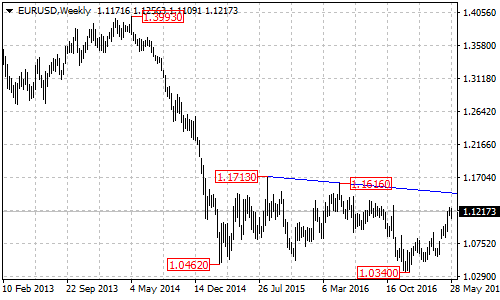
EURUSD might be forming a double bottom pattern on its weekly chart. The first bottom is at the March 2015 low of 1.0462, the second bottom is at the January 2017 low of 1.0340, and the neckline is from the August 2015 high of 1.1713 to the May 2016 high of 1.1616, now at around 1.1450. The price has to break through the neckline before confirming this reversal formation.
On the daily chart
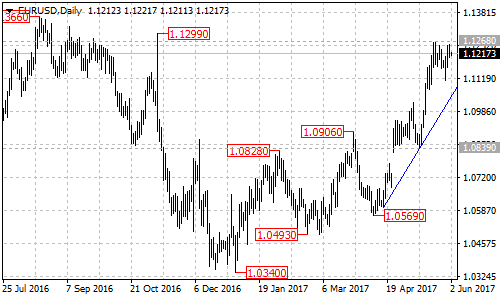
EURUSD stays above the ascending trend line with support at around 1.1040 on the daily chart, indicating that the pair remains in the bullish movement from the April 10 low of 1.0569. As long as the pair is above the trend line, the pullback from 1.1268 could be treated as consolidation of the uptrend. Range trading between 1.1040 and 1.1268 would likely be seen over the next several days. Near term resistance is at 1.1268, a break through this level could take price to the next resistance level at around 1.1450 (the neckline resistance).
Break through 1.1450 resistance
A clear break out of the neckline resistance at 1.1450 will indicate that the long term downtrend from the May 2014 high of 1.3993 had completed at 1.0340 already, then the following bullish movement could bring price to 1.2700 area.
On the downside
Let’s back to the daily chart. A clear break below the trend line support at 1.1040 will suggest that the short term uptrend from 1.0569 had completed at 1.1268 already, then the pair will find support at around 1.0950.
Technical levels
Support levels: 1.1040 (trend line support on daily chart), 1.0950.
Resistance levels: 1.1268 (near term resistance), 1.1450 (the neckline of the double bottom pattern), 1.2700 (measured move target).