
TXN completed a zigzag correction from the July 2025 high, finishing right inside the blue-box support area where new buying interest emerged. The stock has since launched into a strong rally from that zone, putting buyers solidly in profit.
Texas Instruments (TXN) is a global semiconductor company known for designing and manufacturing analog and embedded processing chips. With products used in everything from industrial equipment to personal electronics, TXN plays a critical role in powering modern technology. Its consistent innovation and strong market presence make it a closely watched stock in the tech sector.
TXN completed its long-term grand supercycle wave ((II)) in October 2002, bottoming near $13. From there, the stock launched into a powerful two-decade advance as grand supercycle wave ((III)) unfolded. Wave (I) of ((III)) peaked in August 2007 at $39.6, followed by a deep wave (II) correction that pulled prices back to around $13.4 in December 2008.
The next major advance—wave (III)—began in December 2008. TXN turned decisively bullish once it broke above its March 2000 all-time high at $99.8, eventually reaching a new peak at $202.2 in October 2021. This high completed wave III of (III) of ((III)). A corrective wave IV followed, lasting until October 2023, after which the stock resumed its climb and posted a fresh high of $220.38 in November 2024.
From the November 2024 peak, TXN pulled back in a 7-swing sequence to complete wave ((2)). That correction ended in the blue-box support area, where buyers stepped back in as anticipated. The stock then rallied sharply in a clean 5-wave advance, completing wave (1) of ((3)) on July 11, 2025.
A wave (2) pullback followed: wave A bottomed on August 1, 2025, wave B peaked on August 22, 2025, and in the September 1, 2025 update, the chart highlighted expectations for wave C to continue lower.

TXN Elliott Wave Analysis – 9/14/2025
On 14th September, I shared another updated blog showing how wave C of (2) was evolving. Thus, I marked the 165.39-138.31 as the blue box buying zone. At this zone, buyers should revive their interests.
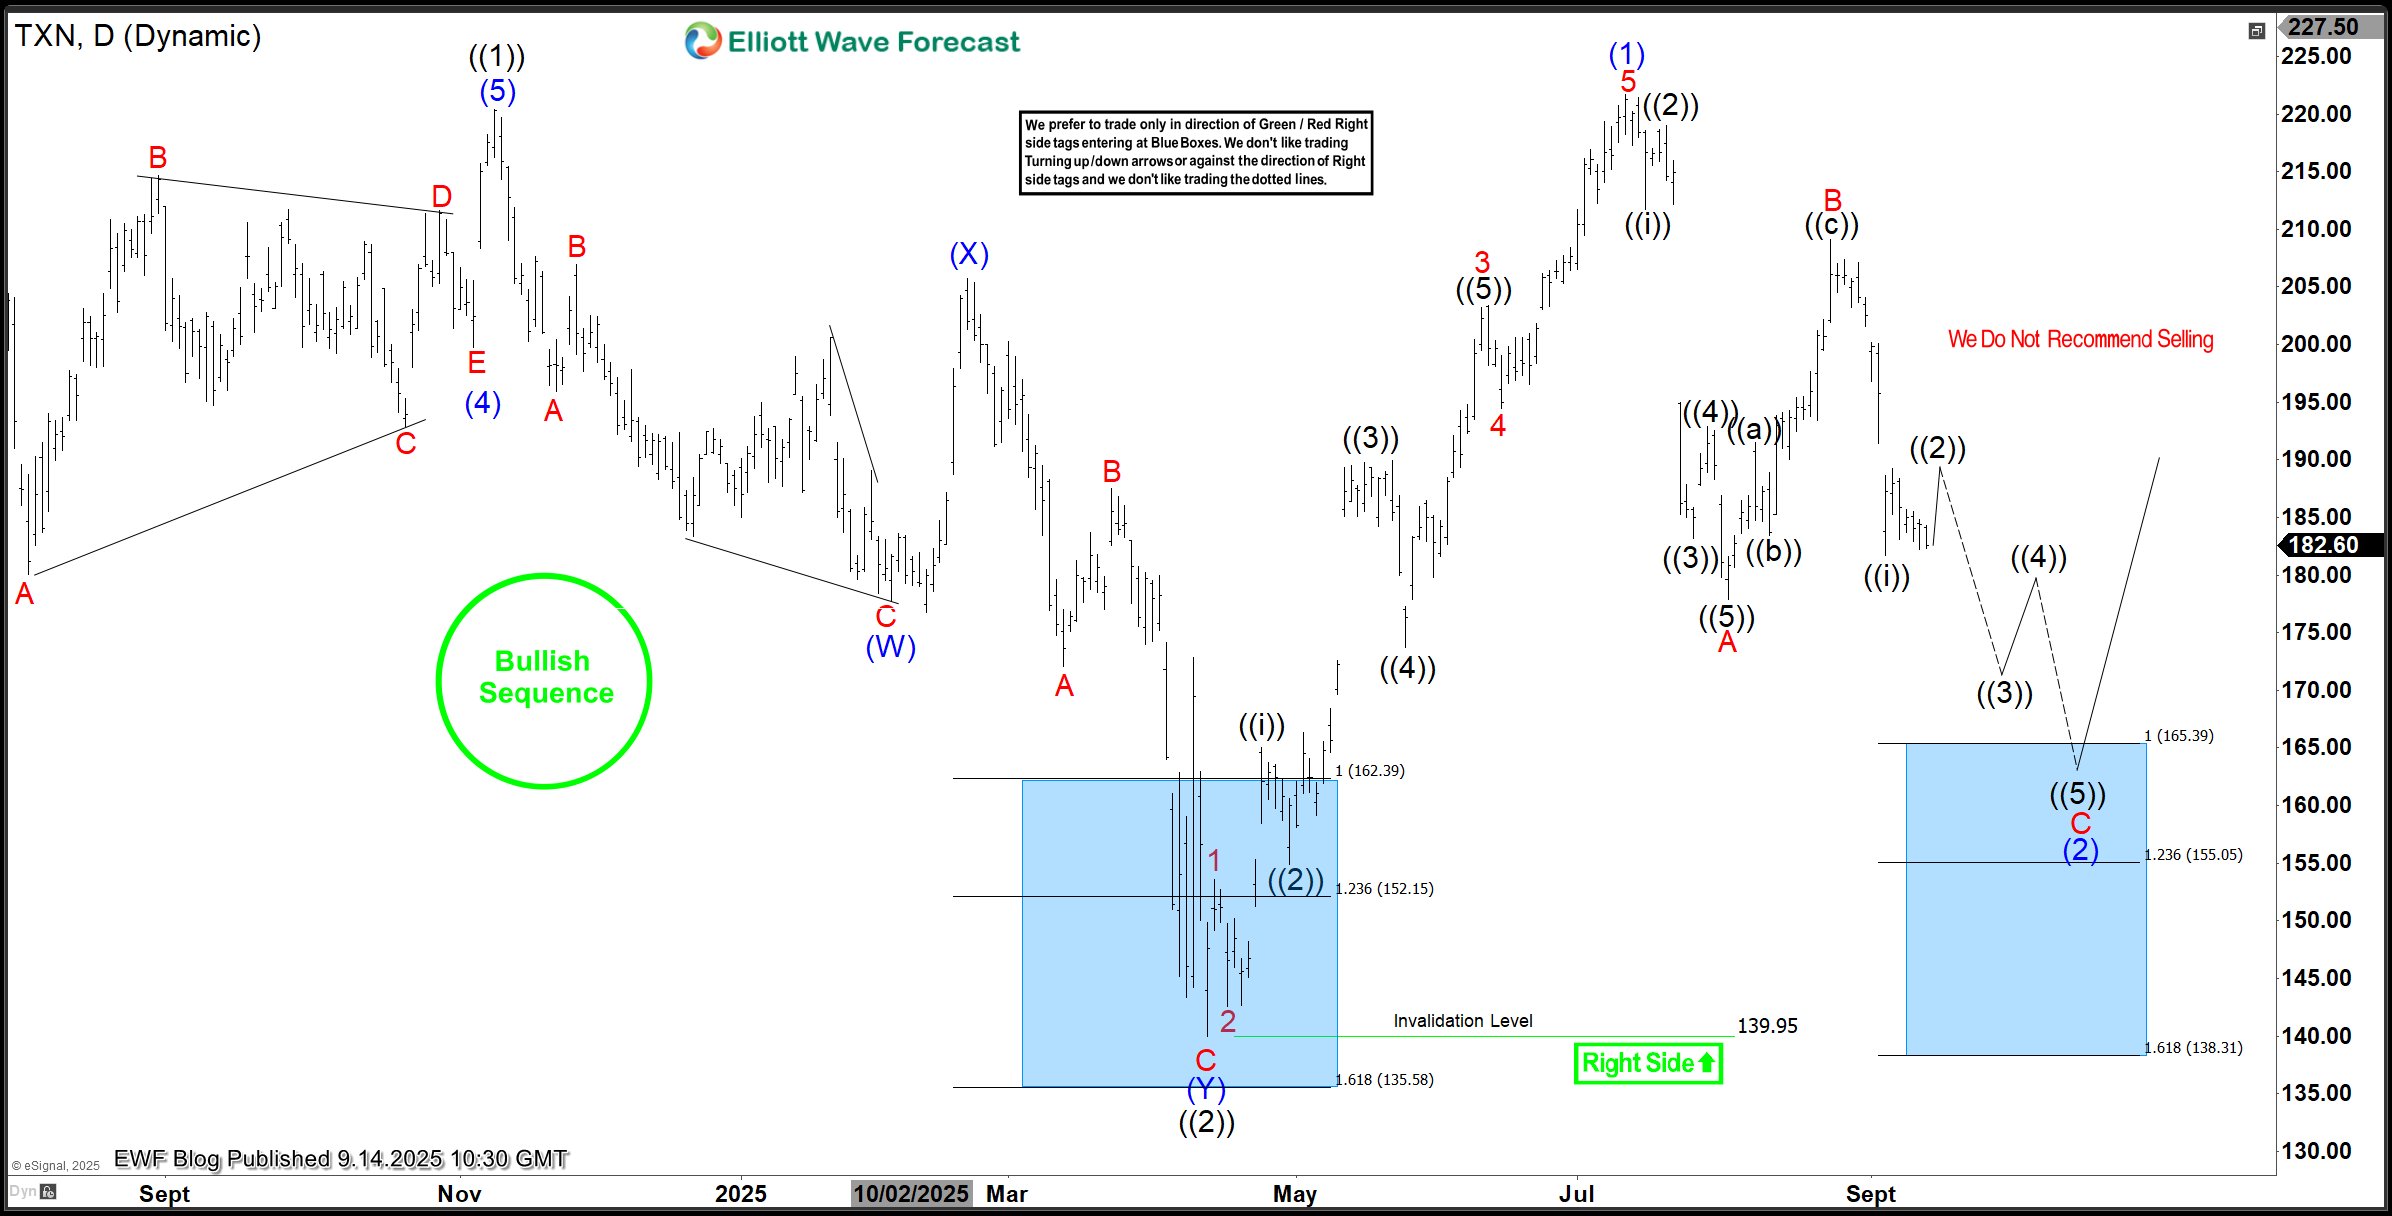
For those who read the last blog, the plan was to buy at 165.39 and set stop at 138.3 while anticipating profits above $220.
TXN Elliott Wave Analysis – 12.03.2025 Update
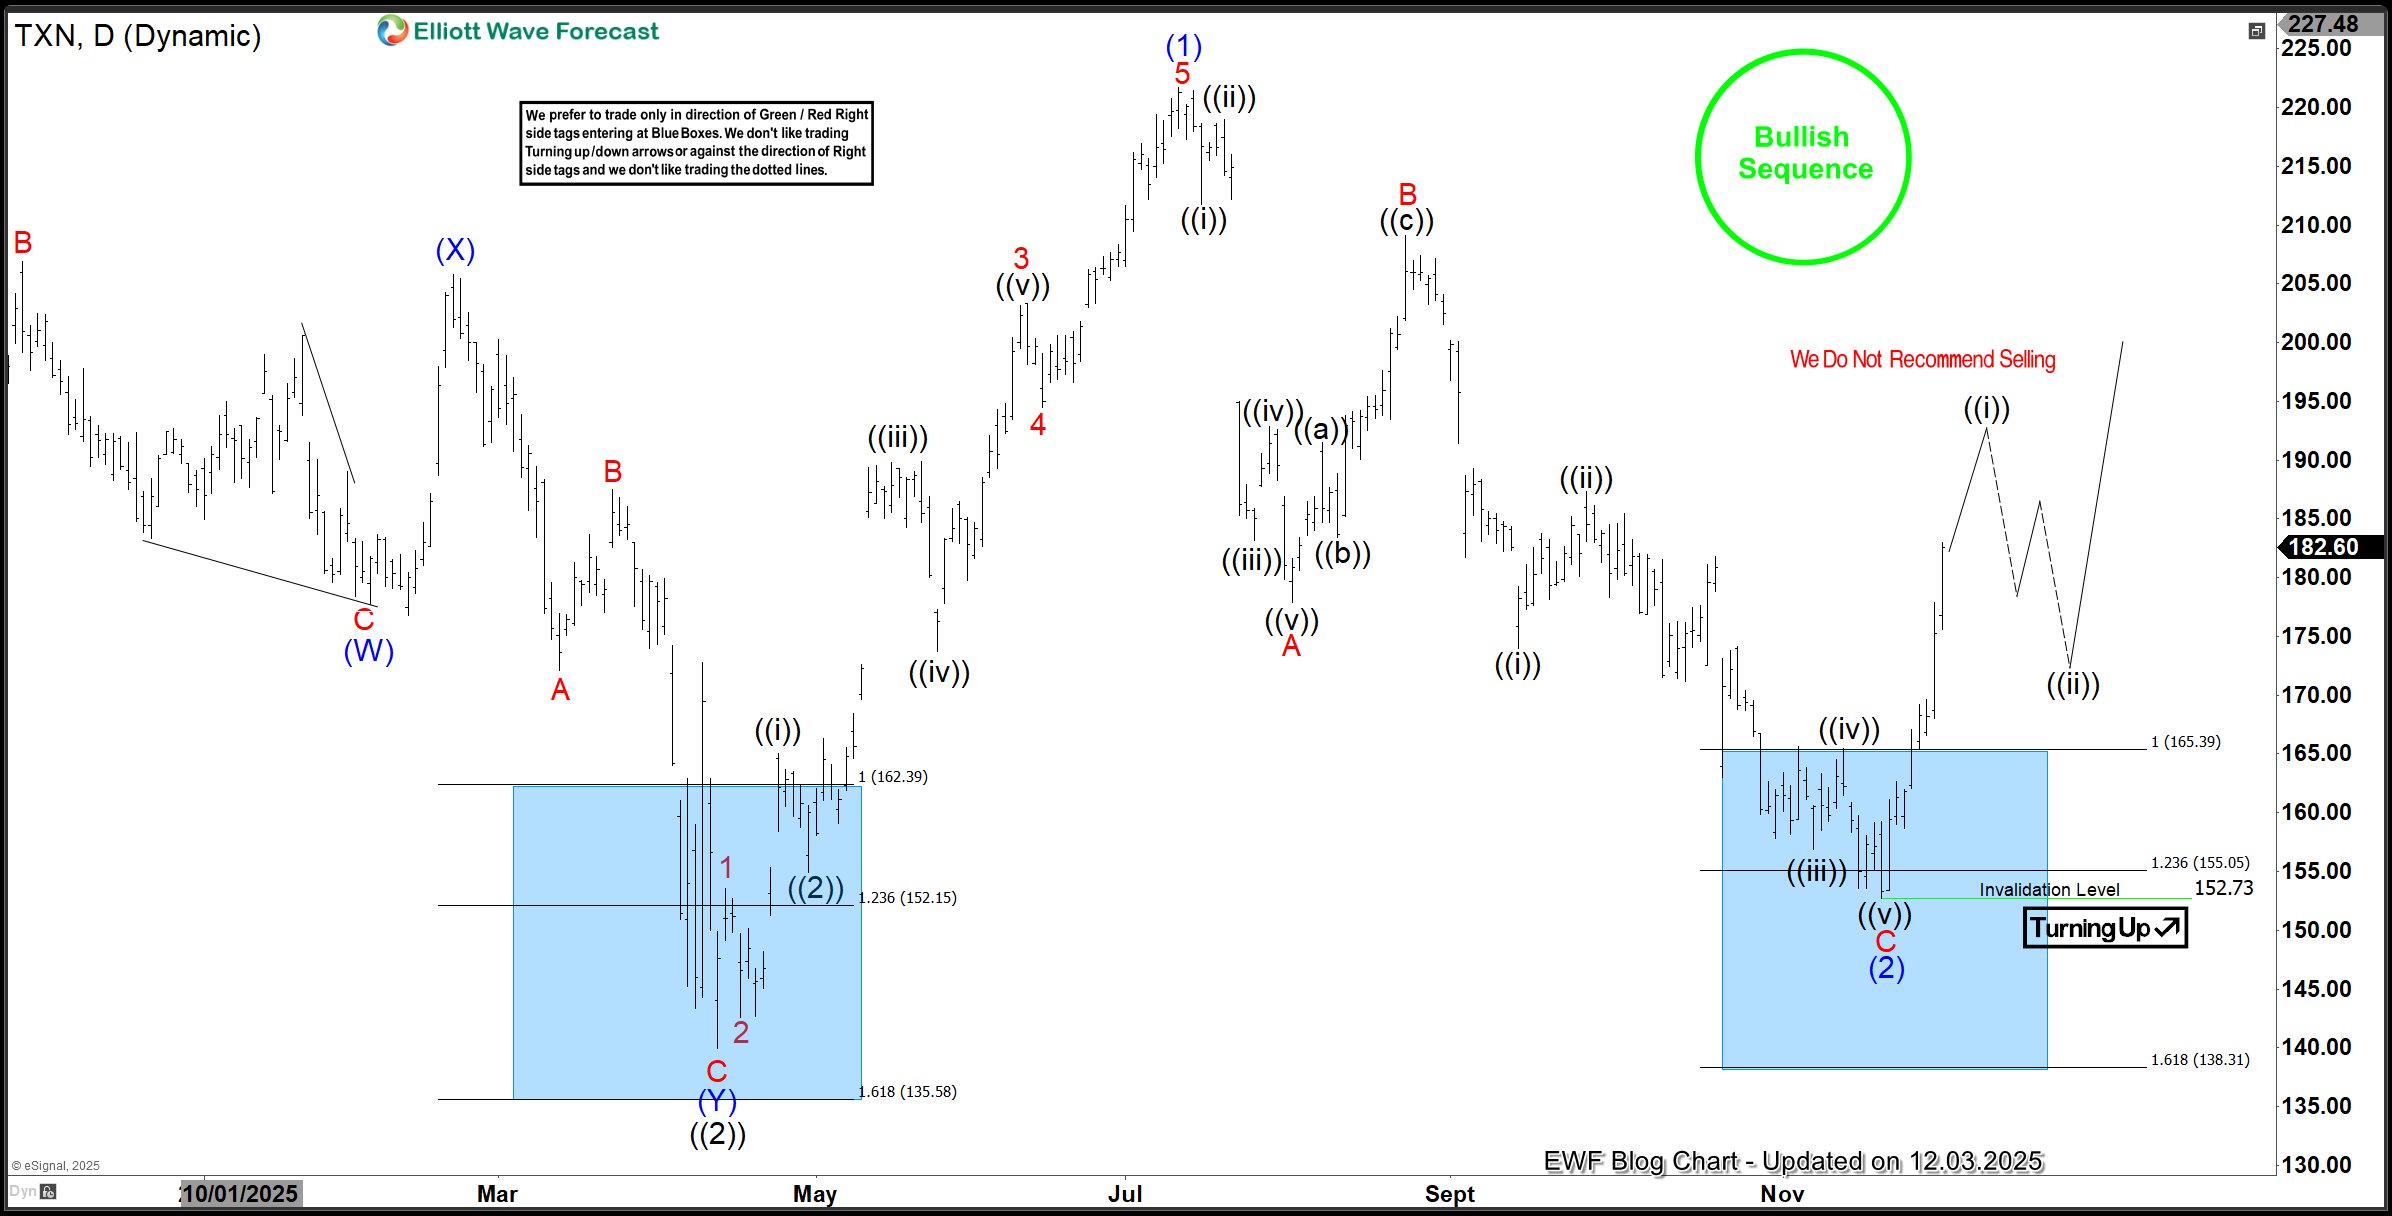
As the chart above shows, wave C of (2) dropped directly into the blue-box support area and completed a full 5-wave decline. This confirmed the end of wave (2), which then produced the expected rebound. With price already reaching the initial target at 180.8, buyers should take partial profits and move the stop for the remaining position to 152.73. This locks in gains and converts the trade into a risk-free setup. Looking ahead, projections suggest wave (3) could extend toward the 253–284 area, with potential for even higher levels.
Source: https://elliottwave-forecast.com/stock-market/txn-rebounds-strongly-off-blue-box/