GBPUSD’s recent price action indicates a potential shift in momentum. This analysis examines the technical situation and explores potential scenarios for the currency pair.
GBPUSD Breaks Above Trend Line:
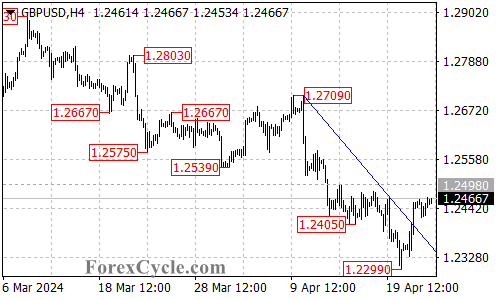
- Downtrend Correction Likely: GBPUSD has decisively broken above the falling trend line on the 4-hour chart. This trend line had been a key resistance level throughout the recent downtrend that began at 1.2892. The breakout suggests a potential correction for the downtrend.
Upside Potential and Targets:
- Further Rally Expected: A further rally could be seen in the coming days. The first potential target zone to watch is around 1.2498, which previously acted as resistance.
- Upside Breakout Levels: A decisive break above 1.2498 would be a bullish signal. This breakout could trigger a further rise towards the 1.2570 area, followed by the 1.2630 area.
Support Levels to Consider:
- 1.2385 Initial Support: The initial support level to monitor is at 1.2385.
- Downtrend Resumption Risk: A breakdown below 1.2385 could indicate a temporary pullback within the correction. However, a further decline below the key support at 1.2299 would be a more bearish sign.
- 1.2299 Crucial Support: A break below 1.2299 would suggest a resumption of the downtrend from 1.2892. In this scenario, the next potential target zone could be around the 1.2200 area.
Overall Sentiment:
The technical outlook for GBPUSD has become uncertain in the short term. The breakout above the trend line suggests a potential correction. However, the future direction of the price will depend on how it behaves around the key support and resistance levels. Close monitoring of these levels is essential to determine if the correction extends or if the downtrend resumes.