USDCAD’s recent price action indicates continued weakness. This analysis examines the technical situation and explores potential scenarios for the currency pair.
USDCAD Stuck in Downtrend:
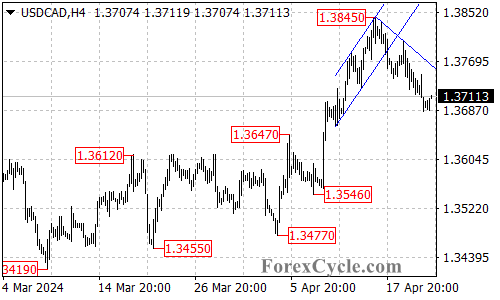
- Falling Trend Line Resistance: A key technical indicator for USDCAD is the falling trend line on the 4-hour chart. As long as the price remains below this trend line, the downtrend that began at 1.3845 is likely to continue.
Downside Trajectory in Focus:
- Lower Targets in Sight: If the downtrend persists, the next potential target zones to watch could be at 1.3650, followed by a deeper decline towards 1.3600.
Signs of a Reversal?
- 1.3720 Initial Resistance: While the immediate outlook remains bearish, there’s a potential sign of a short-term correction. A break above the initial resistance level at 1.3720 could indicate such a correction.
- Limited Upside Potential in Correction: However, even if the price breaks above 1.3720, it is likely to encounter resistance again at the falling trend line.
Trend Reversal or False Hope?
- Trend Line Breakout as Bullish Signal: A decisive break above the falling trend line resistance would be the most significant development. This move could signal a completion of the downtrend.
- Upside Target If Downtrend Ends: If the downtrend reverses, another rise towards the previous high of 1.3845 could be seen.
Overall Sentiment:
The technical outlook for USDCAD remains bearish in the short term. The price action below the falling trend line suggests a continuation of the downtrend. However, a break above the initial resistance at 1.3720 could indicate a temporary correction. Only a breakout above the trend line itself would suggest a potential trend reversal. Close monitoring of price action around these key levels will be crucial in determining the future direction of USDCAD.