
GBPUSD’s recent price action suggests continued weakness. This analysis examines the technical situation and explores potential scenarios for the currency pair.
GBPUSD Stuck in Downtrend:
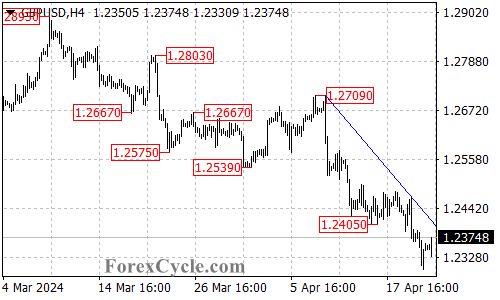
- Falling Trend Line Resistance: A key technical indicator for GBPUSD is the falling trend line on the 4-hour chart. As long as the price remains below this trend line resistance, the downtrend that began at 1.2709 is likely to continue.
Downside Target in Focus:
- Further Decline Expected: If the downtrend persists, the next potential target zone to watch could be around the 1.2200 area.
Upside Scenario: Signs of a Correction?
- Trend Line Breakout as Bullish Signal: A breakout above the falling trend line resistance would be a significant development. This move could indicate a potential correction within the broader downtrend.
Resistance Levels to Consider:
- 1.2435 Next Resistance: If the price manages to break above the trend line, it could encounter resistance again at 1.2435.
- Upside Targets If Correction Confirmed: A further rise above 1.2435 would suggest a lengthier correction for the downtrend from 1.2893. In this scenario, the next potential target zones could be 1.2570 and 1.2630 areas.
Overall Sentiment:
The technical outlook for GBPUSD remains bearish in the short term. The price action below the falling trend line suggests a continuation of the downtrend. However, a breakout above the trend line could signal a potential correction. Close monitoring of price action around the key resistance levels will be crucial in determining the future direction of GBPUSD.