ForexCycle.com
EA Builder
  • Home
  • Forex Analysis
    • Long Term Forex Analysis
    • Short Term Forex Analysis
    • Special Focus
    • Daily Forex Reports
    • Forex Signals
  • Forex Articles
    • Market Cycle
    • Indicator
    • Elliott Wave
    • Fibonacci Sequence
    • Forex Market
    • Forex Trading
    • Technical Analysis
    • Chart Pattern
  • Trading Strategy
  • Forex Brokers
    • Avatrade
    • Broker News
    • Broker Review
  • Elliott Wave Courses
    • Markets Reverse
    • 5 Ways Using Trendlines
    • Overview of MACD
    • Relative Strength Index
    • Japanese Candlesticks
    • Moving Averages
    • Fibonacci Ratios
    • Two-Bar Pattern
    • Market Myths Exposed
  • Contact Us

USDJPY Daily Analysis – September 6, 2017

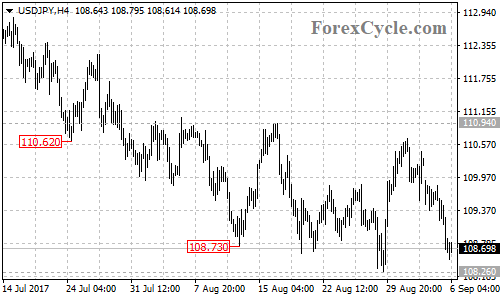
USDJPY stays in a trading range between 108.26 and 110.94 and is now facing 108.26 support. A breakdown below this level could signal resumption of the downtrend from 114.49 (Jul 11 high), then next target would be at 106.50 area. On the other side, as long as 108.26 support holds, the range trading could be expected to continue.

USDJPY 4-hour chart

Author ForexCycle.comPosted on September 6, 2017Categories Short Term Forex AnalysisTags USDJPY

Post navigation

Previous Previous post: AUDUSD Daily Analysis – September 6, 2017
Next Next post: USDCAD Daily Analysis – September 6, 2017

Resources

  • Unlock Your Trading Potential with EA Builder
  • Elliott Wave Principle

Recent Posts

  • Elliott Wave Analysis: SPY Poised To Extend Higher In Bullish Sequence
  • Elliott Wave Sequence Supports Rally In Dow Jones Futures (YM_F) From Extreme Area
  • EUROSTOXX Index (SX5E): A Classic Reaction Higher from Equal Legs
  • Alnylam (ALNY) Eyes for ((3)) Rally Toward $368–$469 Zone
  • Advanced Micro Devices $AMD Soars 90% from Blue Box Area, With $154 Target Still Ahead
  • GOLD (XAUUSD) Calling the Rally from the Intraday Equal Legs Area
  • Silver Miners ETF (SIL) Acceleration Phase Has Begun
  • Nu Holdings (NYSE: NU) Completes Elliott Wave (II) Correction
  • NASDAQ (NQ_F) Elliott Wave: Forecasting the Rally From the Equal Legs Zone
  • S&P 500 E-Mini (ES_F) Found Buyers at the Equal Legs Zone
  • Facebook
  • Instagram
  • Twitter
  • LinkedIn
  • Telegram
  • Home
  • Forex Analysis
  • Forex Articles
  • Contact Us
  • Forex Blog
  • Disclaimer
  • Forex Resources
  • Archives
  • RSS
Copyright © 2005 - 2025 ForexCycle.com. All rights reserved.