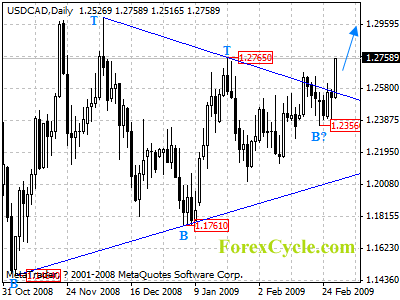
USDCAD breaks out of the triangle pattern on daily chart and is testing the 1.2765 resistance. A break above this level will signal further rally to test 1.3015 long term key resistance. Above this level will indicate that the long term uptrend from 0.9056 (Nov 7, 2007 low) has resumed and the next target is expected to 1.3500 zone.
For long term analysis, USDCAD remains in bullish movement, and the price action from 1.3015 is treated as consolidation of long term up trend. Further rise towards 1.4000 to reach the next cycle top on monthly chart is expected.


