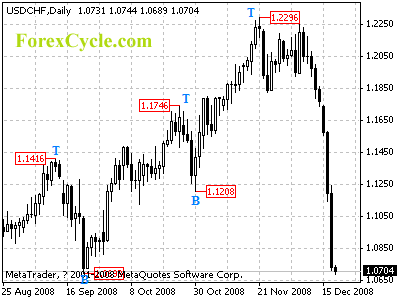
USDCHF dropped sharply in last two trading days, suggesting that the long term up trend from 0.9634 (Mar 17 low) has completed. Deeper decline is still possible to 1.0500 to reach the next cycle bottom on daily chart is possible in next several days, and the next cycle bottom is nearing.
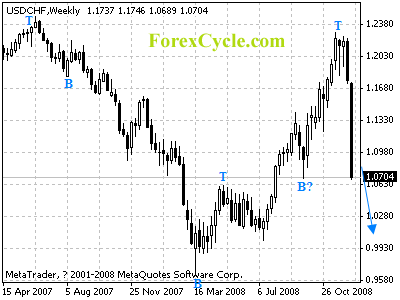
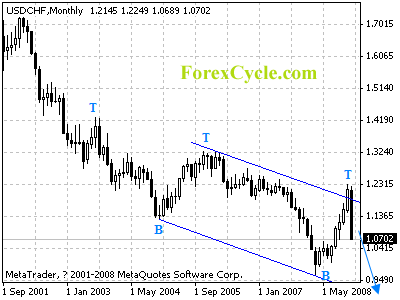
For long term analysis, USDCHF has formed a cycle top at 1.2296 on weekly and monthly chart. Further fall to retest 0.9634 (Mar 17 low) support could be seen.


