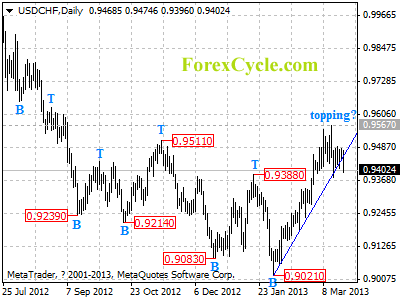
USDCHF breaks below the upward trend line on daily chart, suggesting that a cycle top is being formed at 0.9567. Further decline would likely be seen next week, and next target would be at 0.9250 area. Resistance is at 0.9567, only break above this level could trigger another rise to 0.9700 zone.
For long term analysis, USDCHF had formed a cycle bottom at 0.9021 on weekly chart. Further rise to 0.9700 could be expected over the next several weeks.


