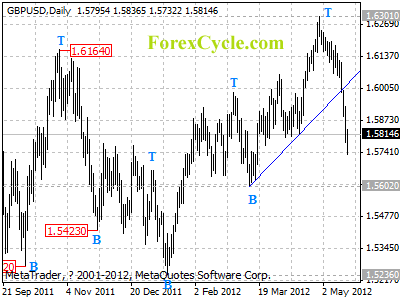
GBPUSD breaks below the upward trend line on daily chart, and reaches as low as 1.5732, suggesting that the upward movement from 1.5236 has completed. Further decline would likely be seen next week, and next target would be at 1.5400-1.5500 area. Resistance is at 1.5900, only break above this level could indicate that a cycle bottom has been formed, then correction of the downtrend from 1.6301 could be seen, and the target would be at 1.6000 zone.
For long term analysis, GBPUSD is in correction of the downtrend from 1.6745 (Apr 28, 2011 high). Another fall towards 1.4500 could be expected after correction.


