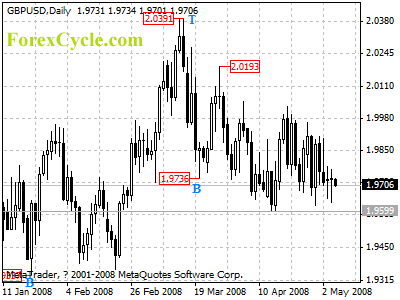
GBPUSD stays in a trading range between 1.9599 and 2.0193. Rebound to 2.0100 area to reach the next cycle top on daily chart would more likely be seen before breaking below 1.9599 previous low. As long as 2.0193 resistance holds, we’d expect down trend to resume and deeper decline to test 1.9337 (Jan 22 low) support is possible after consolidation.
For long term analysis, the pair is in long term bearish movement. The rise from 1.9337 (Jan 22 low) is treated as correction to the long term down trend. Further fall towards 1.8000 area to reach the next long term cycle bottom on weekly chart is still possible.

