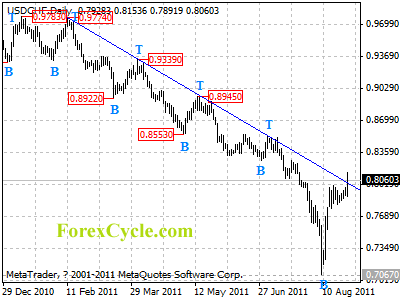
USDCHF broke above the downtrend line on daily chart, suggesting that the fall from 0.9774 has completed at 0.7067 already. Further rally is still possible in a couple of weeks, and next target would be at 0.8500 area. Support is at 0.7770, only break below this level could bring price back to 0.7500 zone.
For long term analysis, USDCHF had formed a cycle bottom at 0.7067 on weekly chart, range trading between 0.7067 and 0.9300 is expected in next several months.

