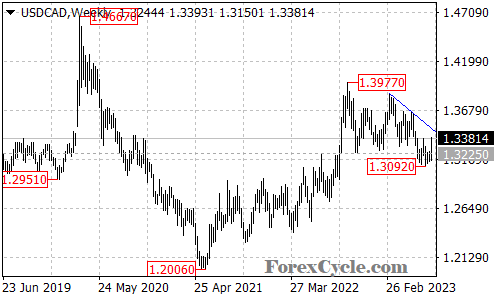
USDCAD is currently confronting the resistance of the falling trend line on the weekly chart.
As long as the price remains below the trend line resistance, the bounce from 1.3092 could be considered a consolidation phase within the long-term downtrend from 1.3977. In this scenario, a breakdown below the support level at 1.3092 could potentially trigger another fall towards 1.2900, followed by 1.2700.
However, if there is a breakout above the trend line resistance, it would suggest that the downside move has already completed at 1.3092. In this case, another rise towards the resistance at 1.3977 could be anticipated.
Traders should closely monitor the price action around the falling trend line and the key support and resistance levels mentioned for potential breakout or reversal signals.
To summarize, the analysis suggests that as long as the trend line resistance holds, USDCAD may resume its downtrend. A breakdown below the support at 1.3092 could trigger further declines. On the other hand, a break above the trend line resistance would indicate a potential reversal and a higher target. Traders should be attentive to key levels and observe the price action for potential trading opportunities.