
Technical indicators play a crucial role in analyzing financial markets, and one of the most popular and widely used indicators is the Moving Average (MA). Its simplicity and effectiveness make it a favorite among traders. In this article, we will explore the use of Moving Averages to determine market trends, identify support and resistance levels, and improve entry timing.
Understanding Moving Averages:
A Moving Average is calculated by taking the average closing prices of a specified period and plotting them on a chart. For example, a 10-day Simple Moving Average (SMA) is calculated by summing up the closing prices of the last 10 days and dividing the sum by 10. This moving average line is then plotted on the chart to provide a smoothed representation of market movements.
Determining Market Trends:
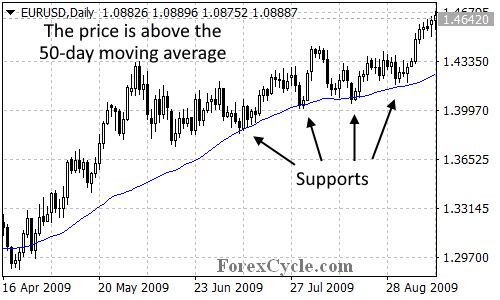
By observing the relationship between the price and the Moving Average, we can gain valuable insights into the market’s direction. In an uptrend, the price tends to remain above the Moving Average, while in a downtrend, it stays below. For instance, let’s consider a daily chart of the EUR/USD with a 50-day Simple Moving Average. If the Moving Average is sloping upward and the price is consistently above it, we can conclude that the pair is in an uptrend. Conversely, if the Moving Average is sloping downward and the price remains below it, a downtrend is likely.
Identifying Support and Resistance:
Moving Averages also serve as useful tools in identifying potential support and resistance levels. When the market reaches the Moving Average line, it often encounters a temporary pause or reversal. These points can be crucial for traders looking to enter or exit positions. By observing how the price reacts to the Moving Average, we can gauge its strength as a support or resistance level. Buying pullbacks in uptrends or selling rallies in downtrends, in conjunction with the Moving Average, can help improve the timing of trades.
Strengths and Weaknesses:
While Moving Averages offer valuable insights, it is essential to understand their strengths and weaknesses. One common mistake made by novice traders is relying solely on the market price crossing the Moving Average or the crossover of two Moving Averages to enter or exit trades. This approach often leads to late entries or exits, resulting in losing trades. Moving Averages are best used as tools for trend determination and support/resistance identification, rather than as standalone signals.
Conclusion:
In conclusion, the use of Moving Averages is a valuable technique for traders seeking to analyze market trends and identify support and resistance levels. By visually representing market movements, Moving Averages provide a clearer understanding of the market’s mood. However, it is important to use Moving Averages in conjunction with other indicators and tools to enhance trading decisions. By understanding the strengths and weaknesses of Moving Averages, traders can better judge their effectiveness and improve their trading strategies. So, embrace the power of Moving Averages and may your trading endeavors be successful!