
- What is EMA and How Does It Work?
- How to Use EMA to Identify Trends in Forex Trading
- How to Use EMA to Identify Reversals in Forex Trading
- How to Combine EMA with Other Technical Indicators in Forex Trading
- Conclusion
If you are looking for a simple and effective way to improve your forex trading performance, you might want to consider using exponential moving average (EMA). EMA is one of the most popular and widely used technical indicators in forex trading. It can help you to identify trends and reversals, which are essential for making profitable trading decisions. In this article, you will learn what EMA is, how it works, and how you can use it to enhance your forex trading skills. Let’s get started!
What is EMA and How Does It Work?
EMA stands for exponential moving average. It is a type of moving average that gives more weight to the recent price data than the older ones. This means that EMA reacts faster to the changes in the price action and reflects the current market conditions more accurately.
A moving average is a line that shows the average price of a currency pair over a certain period of time. For example, a 50-day EMA shows the average price of the last 50 days. A moving average can help you to smooth out the fluctuations in the price and see the overall trend more clearly.
To calculate EMA, you need to use a formula that involves a smoothing factor. The smoothing factor determines how much weight is given to each price data point. The higher the smoothing factor, the more responsive the EMA is to the recent price changes. The lower the smoothing factor, the more stable the EMA is and the less prone to false signals.
The formula for calculating EMA is:
EMA = (Current Price – Previous EMA) x Smoothing Factor + Previous EMA
The smoothing factor is calculated as:
Smoothing Factor = 2 / (Number of Periods + 1)
For example, if you want to calculate a 10-day EMA, you need to use a smoothing factor of 0.1818 (2 / (10 + 1)). You can use any number of periods for EMA, depending on your trading style and preferences. Some common EMA settings are 5, 10, 20, 50, 100, and 200.
You can apply EMA to any time frame and currency pair in forex trading. You can also use multiple EMAs with different settings to get more information and insights from the market.
How to Use EMA to Identify Trends in Forex Trading
One of the main advantages of using EMA in forex trading is that it can help you to identify trends. A trend is a general direction of the market movement over a period of time. There are three types of trends: uptrend, downtrend, and sideways trend.
An uptrend is when the price makes higher highs and higher lows. A downtrend is when the price makes lower highs and lower lows. A sideways trend is when the price moves within a range without a clear direction.
Trends are important because they indicate the dominant market sentiment and momentum. You can use trends to align your trading decisions with the market direction and increase your chances of success.
EMA can help you to determine the direction and strength of the trend by showing you how the price relates to the moving average line. Here are some basic rules for using EMA to identify trends:
- If the price is above the EMA, it indicates an uptrend.
- If the price is below the EMA, it indicates a downtrend.
- If the price crosses above or below the EMA, it indicates a possible trend change.
- If the price stays close to the EMA, it indicates a strong trend.
- If the price moves away from the EMA, it indicates a weak trend.
You can also use different EMAs with different settings to identify trends on different time frames and levels. For example, you can use a 50-day EMA to identify the long-term trend, a 20-day EMA to identify the medium-term trend, and a 10-day EMA to identify the short-term trend.
You can also use multiple EMAs with similar settings to create an EMA ribbon or fan. This is when you plot several EMAs on your chart with small increments between them. For example, you can plot EMAs with settings of 5, 6, 7, 8, 9, and 10 on your chart.
An EMA ribbon or fan can help you to see how strong or weak the trend is by showing you how wide or narrow the gap between the EMAs is. The wider the gap between the EMAs, the stronger the trend is. The narrower or overlapping gap between the EMAs, the weaker or reversing the trend is.
Here are some examples of how to use EMA to identify trends in forex trading:
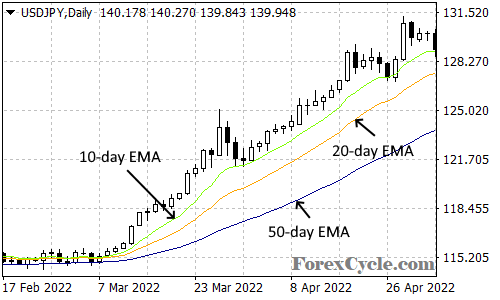
In this example, you can see that the price is above the 50-day EMA, indicating a long-term uptrend. The price is also above the 20-day EMA and the 10-day EMA, indicating a medium-term and short-term uptrend. The gap between the EMAs is wide, indicating a strong trend.
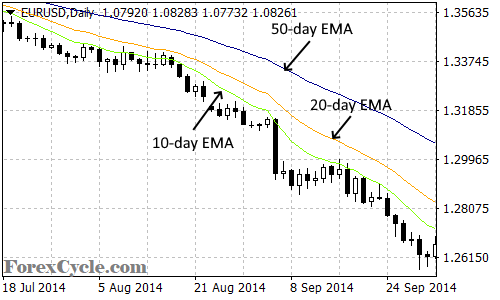
In this example, you can see that the price is below the 50-day EMA, indicating a long-term downtrend. The price is also below the 20-day EMA and the 10-day EMA, indicating a medium-term and short-term downtrend. The gap between the EMAs is wide, indicating a strong trend.
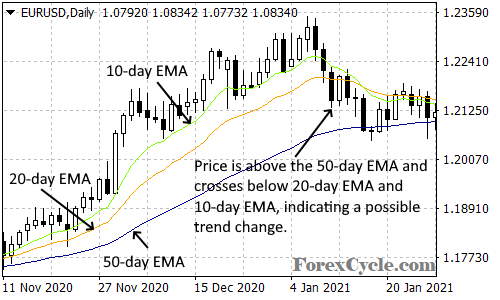
In this example, you can see that the price is above the 50-day EMA, indicating a long-term uptrend. However, the price crosses below the 20-day EMA and the 10-day EMA, indicating a possible trend change. The gap between the EMAs is narrow or overlapping, indicating a weak or reversing trend.
How to Use EMA to Identify Reversals in Forex Trading
Another advantage of using EMA in forex trading is that it can help you to identify reversals. A reversal is when the price changes its direction from an uptrend to a downtrend or vice versa. Reversals are important because they indicate the end of a trend and the start of a new one. You can use reversals to exit your current trades and enter new ones in the opposite direction.
EMA can help you to spot potential reversal points by showing you when the price crosses above or below the moving average line. This is called an EMA crossover signal. An EMA crossover signal can indicate a change in the trend direction and momentum.
There are two types of EMA crossover signals: bullish and bearish. A bullish EMA crossover signal is when the price crosses above the EMA from below. A bearish EMA crossover signal is when the price crosses below the EMA from above.
You can also use different EMAs with different settings to generate different types of EMA crossover signals. For example, you can use a fast EMA and a slow EMA to create an EMA crossover strategy. A fast EMA is an EMA with a lower number of periods, such as 10. A slow EMA is an EMA with a higher number of periods, such as 50.
An EMA crossover strategy can help you to identify short-term or long-term reversals by showing you when the fast EMA crosses above or below the slow EMA. Here are some basic rules for using an EMA crossover strategy:
- If the fast EMA crosses above the slow EMA, it indicates a bullish reversal.
- If the fast EMA crosses below the slow EMA, it indicates a bearish reversal.
- If the fast EMA and the slow EMA are close together, it indicates a consolidation or indecision in the market.
- If the fast EMA and the slow EMA are far apart, it indicates a strong trend in the market.
You can also use multiple EMAs with similar settings to create an EMA ribbon or fan crossover strategy. This is when you plot several EMAs on your chart with small increments between them and look for when they cross each other.
An EMA ribbon or fan crossover strategy can help you to identify more reliable reversal signals by showing you when multiple EMAs cross each other in succession. Here are some basic rules for using an EMA ribbon or fan crossover strategy:
- If multiple EMAs cross above each other from below, it indicates a bullish reversal.
- If multiple EMAs cross below each other from above, it indicates a bearish reversal.
- If multiple EMAs are close together or overlapping, it indicates a consolidation or indecision in the market.
- If multiple EMAs are far apart or fanning out, it indicates a strong trend in the market.
Here are some examples of how to use EMA to identify reversals in forex trading:
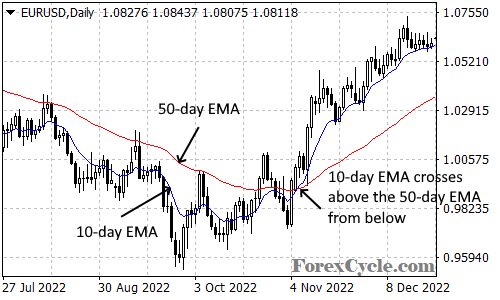
In this example, you can see that there is a bullish reversal signal when the 10-day EMA (blue line) crosses above the 50-day EMA (red line) from below. This indicates that the downtrend has ended and the uptrend has started. The price moves away from the EMAs, indicating a strong trend. The gap between the EMAs is wide, indicating a strong trend.
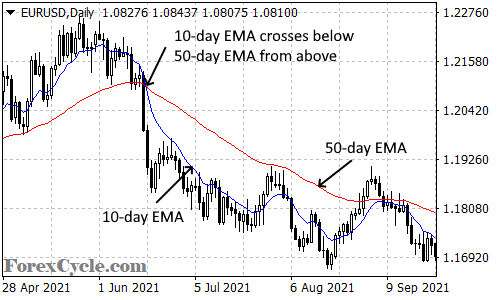
In this example, you can see that there is a bearish reversal signal when the 10-day EMA (blue line) crosses below the 50-day EMA (red line) from above. This indicates that the uptrend has ended and the downtrend has started. The price moves away from the EMAs, indicating a strong trend. The gap between the EMAs is wide, indicating a strong trend.
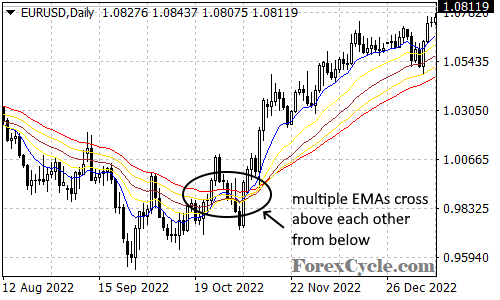
In this example, you can see that there is a bullish reversal signal when multiple EMAs cross above each other from below. This indicates that the downtrend has ended and the uptrend has started. The price stays close to the EMAs, indicating a strong trend. The gap between the EMAs is wide, indicating a strong trend.
How to Combine EMA with Other Technical Indicators in Forex Trading
Another advantage of using EMA in forex trading is that it can help you to combine it with other technical indicators to enhance your trading analysis and signals. Technical indicators are tools that use mathematical formulas to analyze the price action and generate trading signals.
There are many types of technical indicators in forex trading, such as trend indicators, momentum indicators, volatility indicators, volume indicators, etc. You can use different technical indicators to measure different aspects of the market and confirm or contradict each other.
EMA can be used as a confirmation tool for other technical indicators by showing you how the price relates to the moving average line. For example, you can use EMA with trend lines, support and resistance levels, Fibonacci retracements, etc. to identify trend continuation or reversal signals.
You can also use EMA with momentum indicators, such as stochastic oscillator, relative strength index (RSI), moving average convergence divergence (MACD), etc. to identify overbought or oversold conditions and divergence signals.
You can also use EMA with volatility indicators, such as Bollinger bands, average true range (ATR), etc. to identify breakout or consolidation signals.
You can also use EMA with volume indicators, such as on-balance volume (OBV), money flow index (MFI), etc. to identify buying or selling pressure and accumulation or distribution signals.
Here are some examples of how to combine EMA with other technical indicators in forex trading:
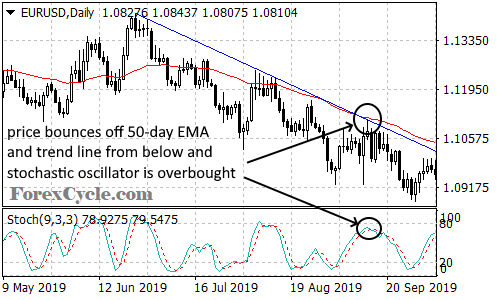
In this example, you can see that there is a trend continuation signal when the price bounces off the 50-day EMA (red line) and the trend line (blue line) from above. This indicates that the downtrend is still intact and the price is likely to continue falling. The stochastic oscillator (bottom panel) also confirms the bearish signal by showing that the price is overbought and there is no divergence.
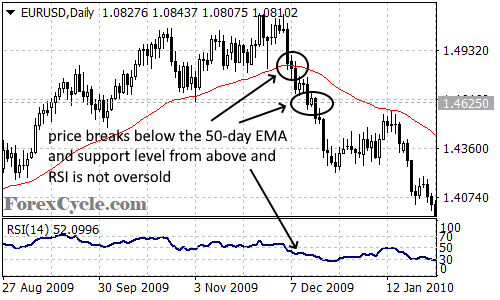
In this example, you can see that there is a trend reversal signal when the price breaks below the 50-day EMA (red line) and the support level from above. This indicates that the downtrend has started and the price is likely to continue falling. The RSI (bottom panel) also confirms the bearish signal by showing that the price is not oversold and there is no divergence.
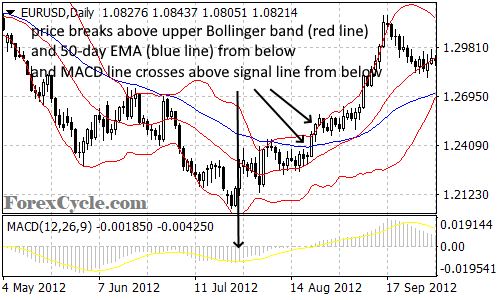
In this example, you can see that there is a breakout signal when the price breaks above the upper Bollinger band (red line) and the 50-day EMA (blue line) from below. This indicates that the volatility has increased and the price is likely to continue rising. The MACD (bottom panel) also confirms the bullish signal by showing that the MACD line crosses above the signal line from below and there is no divergence.
Conclusion
EMA is one of the most useful and versatile technical indicators in forex trading. It can help you to identify trends and reversals, which are crucial for making profitable trading decisions. You can also combine EMA with other technical indicators to enhance your trading analysis and signals.
EMA is easy to use and apply to any time frame and currency pair in forex trading. You can also customize EMA to suit your trading style and preferences by choosing different settings and numbers of periods.
EMA is not a perfect indicator, however. It can also generate false or lagging signals, especially in choppy or sideways markets. Therefore, you should always use EMA with caution and discretion, and not rely on it blindly. You should also use EMA with other tools and factors, such as price action, fundamental analysis, risk management, etc. to improve your trading performance.
We hope you enjoyed this article and learned something new and useful. If you have any questions or feedback, please feel free to leave a comment below. Happy trading! 😊