
By Elliott Wave International
Elliott Wave International President Robert Prechter has noted that stock market volume is the most important indicator to watch besides price.
Market volume waxes and wanes. However, there are times when volume goes on mini-streaks, either expanding or contracting for four or five consecutive days.
Yet, six consecutive days is almost unheard of. But, it just happened, ending on Aug. 22. That’s only the third time that volume has contracted six days in a row since 1987.
Let’s get the commentary from the Aug. 23 U.S. Short Term Update.

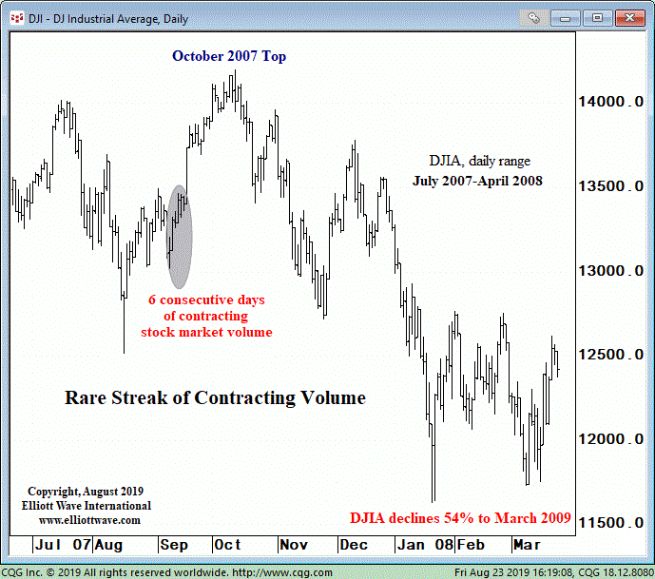
The grey ellipse shows when stock market volume contracted for six straight sessions in 2007. This streak happened with the Dow at the top end of a sideways consolidation after the spike low on August 16, 2007.
By this measure, the current volume contraction can be a buy signal, at least in the short term.
But the same Aug. 23 U.S. Short Term Update also shows subscribers another period when volume contracted for six straight sessions, and what happened next.
I will save the details for the August 23 Short Term Update. Right now, and through August 29, you don’t have to be our subscriber to read it yourself, completely free. You happen to be visiting our website during one of our rare open-doors events that we call FreeWeek.
“Free” means free: All you need is to sign up for a Club EWI password, which also gives you access to lots of other free, unique resources for investors and traders.
So, jump right in and read our flagship Financial Forecast Service, which includes the U.S. Short Term Update. Just look below to get started instantly.
Forex FreeWeek | Nov. 8-15
Happening Now: U.S. Markets FreeWeek
August 22-29 | FREE
For one whole week, get our experts’ ongoing unbiased Elliott-based picture of all the key U.S. markets – stocks, bonds, gold, the dollar.