For Q2 2026, SMH may show mixed behavior as momentum cools. However, the sector still holds a strong long‑term trend. Current conditions suggest slower gains, yet buyers may defend key supports. As a result, the market could stabilize before attempting another advance.
Even so, rising volatility may pressure short‑term swings. Therefore, traders should expect sharper pullbacks and faster rotations. If demand strengthens, SMH could resume its impulsive path. If not, the sector may enter a broader consolidation phase. Discipline and tactical awareness remain essential.
Elliott Wave Outlook: SMH Daily Chart September 27th, 2025
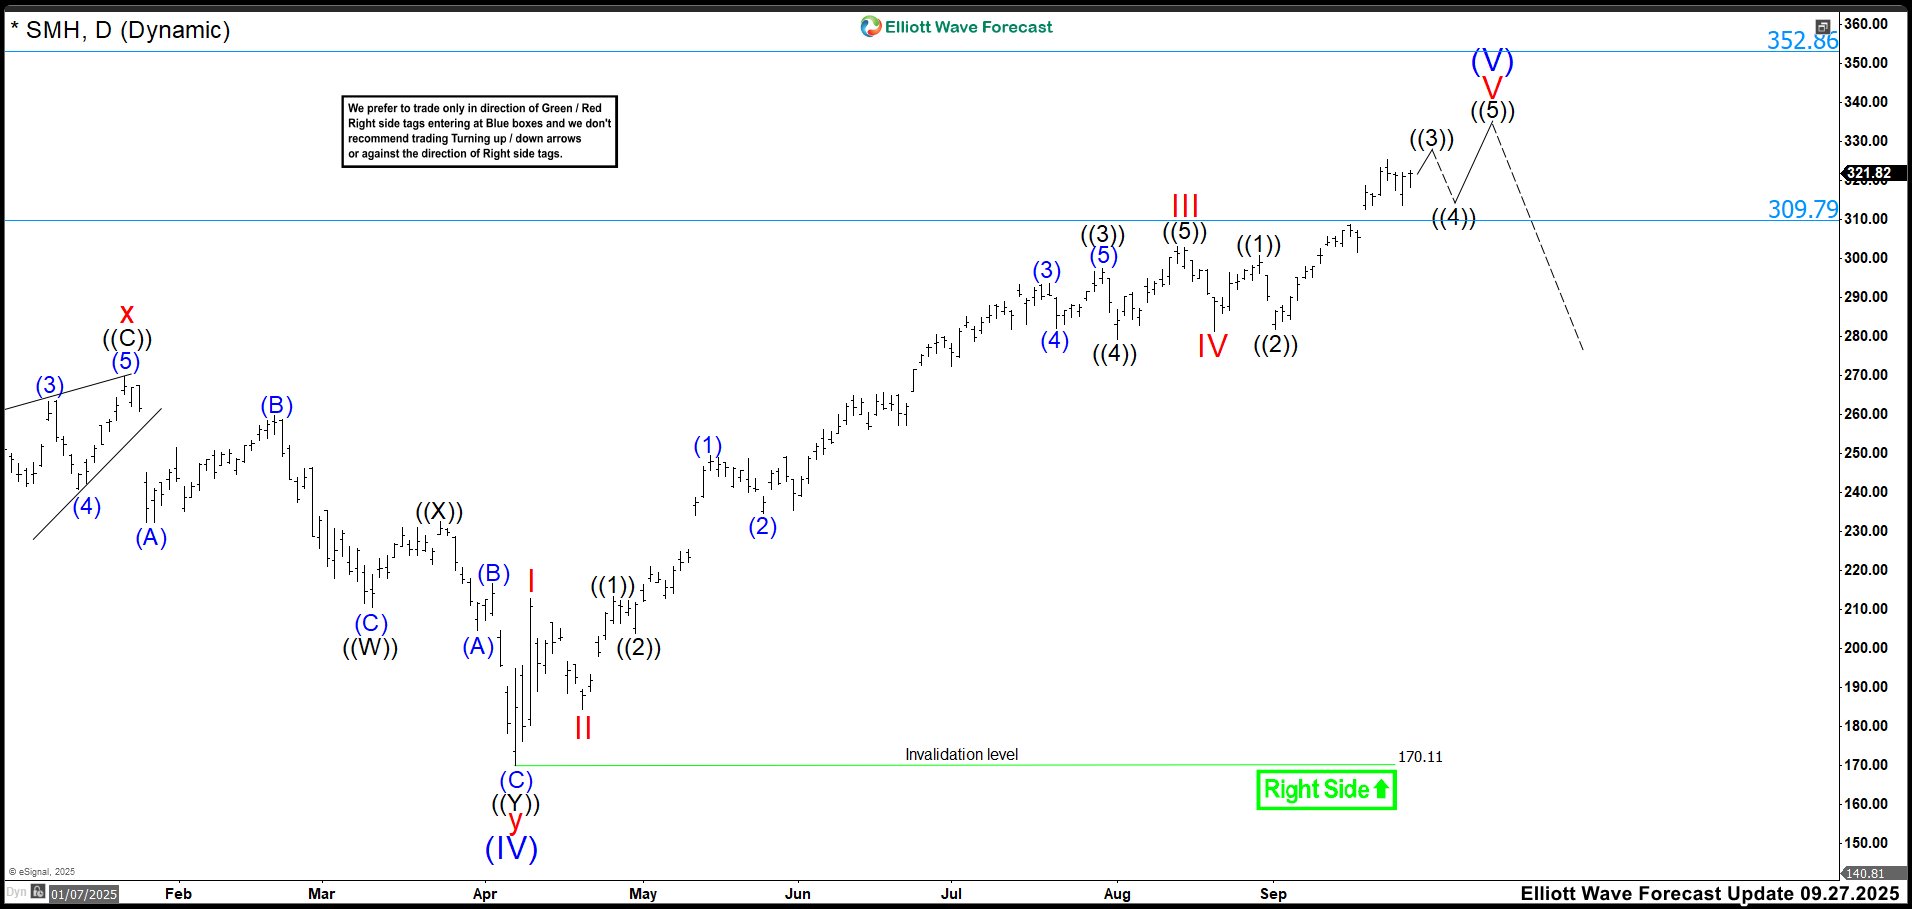
Last year, SMH showed a strong impulsive structure. Moreover, all signals suggested that wave V was already in progress. The weekly chart also hinted that wave III was still unfolding, but we adopted a conservative stance. The structure from the 170.11 low stayed intact. Bullish momentum controlled the market unless evidence showed otherwise.
We expected wave ((3)) to peak by late September. Then, we projected a quick wave ((4)) correction through October. If the pattern held, November and December were likely to deliver a final rally. After that, we anticipated a broader reset in early 2026.
SMH traded inside the 309.83–353.03 zone. This area often marked exhaustion and possible reversals. Therefore, we urged traders to stay alert and act with precision. The wave V structure looked clean and actionable. Our strategy remained simple: buy dips after corrections in 3, 7, or 11 swings. Momentum favored the bulls, but risk increased inside that zone. A sharp correction could appear at any moment. We watched for topping signs and failed breakouts. Discipline guided every decision. We rode the impulse while it lasted and stayed ready to pivot.
Elliott Wave Principle Behind the Market Structure
Impulse
An impulse is a clean 5‑wave pattern that drives the trend forward.
- Waves 1‑3‑5 are strong and directional.
- No overlap between waves 1 and 4.
- Wave 3 is usually the strongest.
- Structure is clear, with increasing momentum.
Wave Extensions
Extensions occur when one impulsive wave becomes significantly longer and more powerful than the others.
Most commonly, wave 3 extends, creating the longest and most explosive leg.
An extended wave subdivides into a clear, elongated 5‑wave pattern.
The other two impulsive waves remain shorter and more proportional.
Extensions highlight where the market’s strongest momentum is concentrated.

Elliott Wave Outlook: SMH Daily Chart March 8th, 2026

In this update of SMH, the market breaks above 152 and signals an extended impulse. This moves forces us to adjust the count and include the extension. Wave ((1)) ends at the April high of 212.81. Wave ((2)) ends at the low of 184.40, and the rally continues. Next, we see the extension inside wave ((3)). We can clearly identify waves (1), (2), (3), (4), and (5). Inside wave (1), the market forms another extension with waves 1, 2, 3, 4, and 5. This behavior shows why we always trade with the trend. Extensions can appear at any moment.
Wave ((3)) ends at the October high. Wave ((4)) ends at the November low. From tHere, we expect one more high to complete wave ((5)) and finish wave I. We shift from wave (V) to wave I as we confirm each correction. For now, we expect a correction of the cycle that began in April 2025. After that, we will evaluate if the pullback can continue.
Wave ((5)) not only creates a new high but also forms an ending diagonal. This pattern suggests the cycle may end soon. The market already breaks below the diagonal, and we expect bearish acceleration to confirm the structure. If the structure confirms, wave II may retrace toward the 329.32–268.42 area before the bullish trend resumes.
Source: https://elliottwave-forecast.com/stock-market/the-april-2025-smh-cycle-looks-officially-complete/