The whole market is on edge. Over the past year, we have seen tariffs, geopolitical conflict, and oil prices skyrocket. All of this has created a high level of uncertainty and fear across global markets.
At ElliottWave-Forecast, we do not focus heavily on fundamentals or news-driven events. Instead, we believe markets are primarily driven by large institutional participants—market makers with sufficient capital to move price. While news is often used to justify moves after the fact, price action itself tends to follow a structured path.
Over the years, we have been able to anticipate major turning points across multiple markets, including the current environment. We have consistently communicated to our members that a correction across risk assets was likely, even though it is impossible to predict which specific global event would be used to explain the move. As expected, the correction unfolded, allowing our members to reposition and buy risk again at favorable levels.
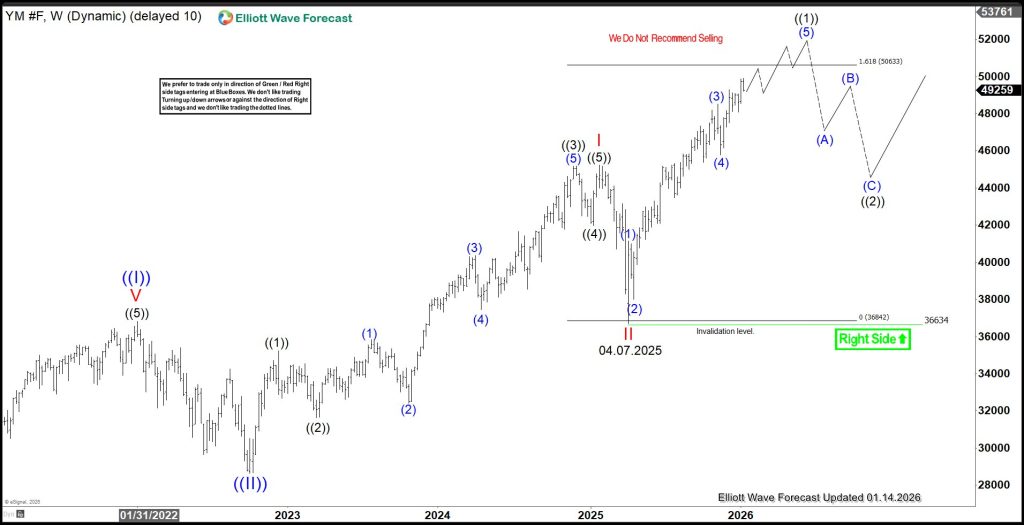
Here is our text about $YM_F explaing what to expect in 2026 :
Dow Futures (YM) weekly Elliott Wave chart suggests the advance from the April 7, 2025 low is completing a 5-wave impulse. The cycle should likely finish in the first quarter of 2026, leading to a significant corrective pullback in 3, 7, or 11 swings. Provided the 36,634 pivot remains intact, the correction should hold support and pave the way for further gains.
Dow Futures (YM) Weekly Elliott Wave Chart
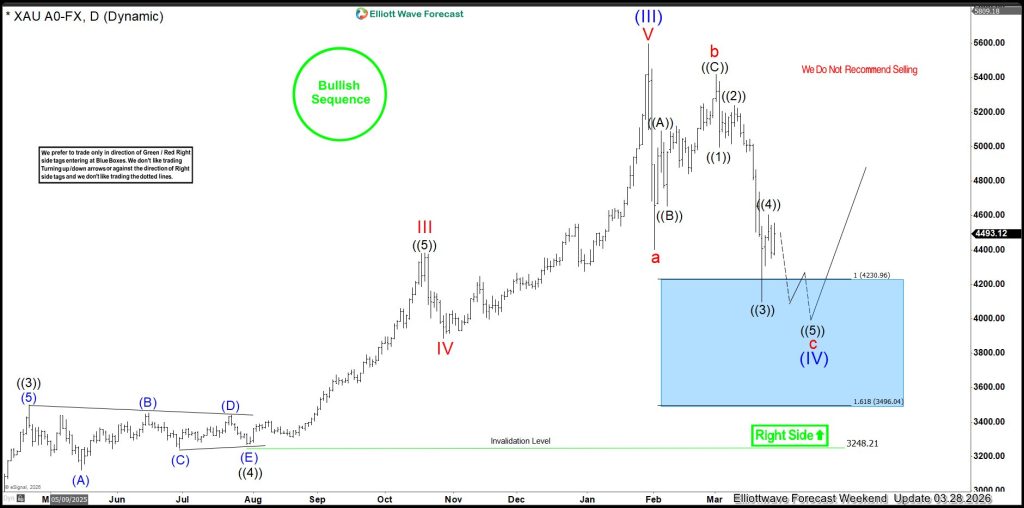
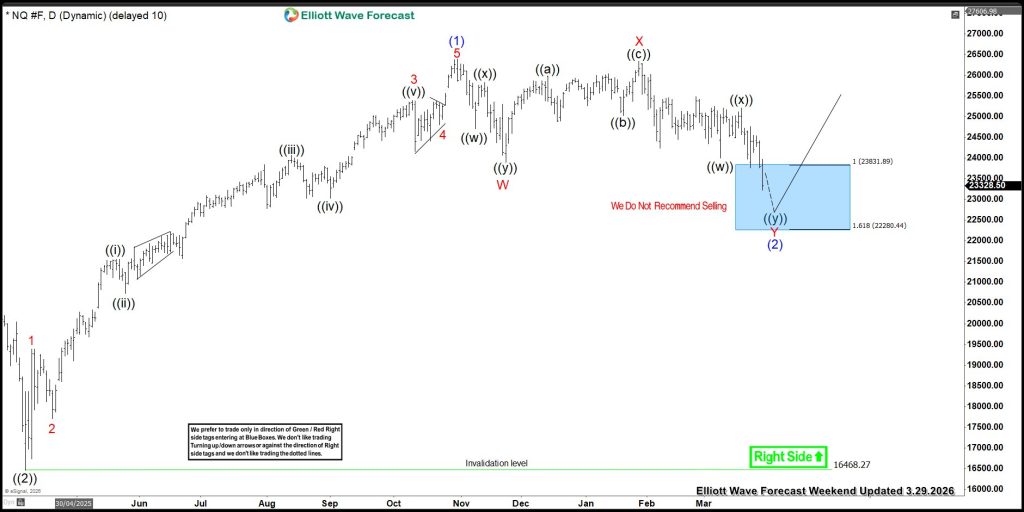
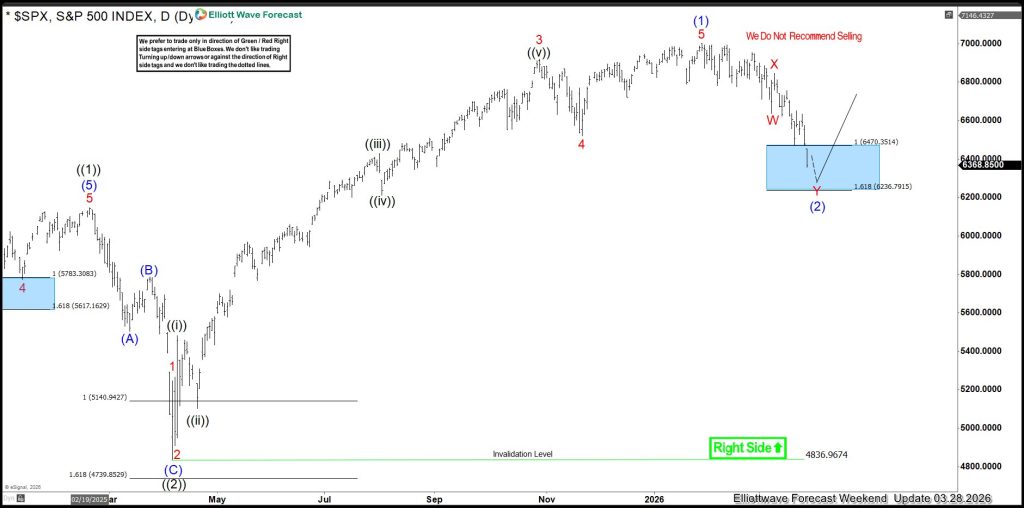
Our methodology is unique. We combine Elliott Wave Theory, pivot systems, correlations, sequences, and extensions to build high-probability forecasts. The “Blue Box” (High-Frequency areas) has consistently identified buying opportunities in instruments such as the S&P 500 (SPX), Gold, and the NASDAQ—levels we shared in advance with our members.
Gold (XAUUSD) Daily Elliott Wave Chart
Nasdaq (NQ) Daily Elliott Wave Chart
SPX Daily Elliott Wave Chart
Today, we will focus on Copper (HG_F), which is showing particularly important price action at the Grand Super Cycle degree. This structure suggests the potential for one of the strongest accelerations in risk assets we have seen in years.
Many traders and analysts may disagree with this view, which is expected. Different methodologies lead to different conclusions. While Elliott Wave analysis can be subjective in interpretation, its core rules are not. The three fundamental rules have zero tolerance for violation:
1) Wave 2 cannot retrace beyond the start of Wave 1
2) Wave 3 cannot be the shortest wave
3) Wave 4 cannot overlap Wave 1
These rules provide a strict framework that, when applied correctly, removes ambiguity from the broader structure. (For reference: https://elliottwave-forecast.com/elliott-wave-theory/)
Looking at Copper on the monthly timeframe, we identify a completed cycle in 2011, labeled as wave (I), followed by a corrective wave (II) ending in 2016. From the 2016 lows, the market produced a clear five-wave advance into March 7, 2022, which we label as wave I, followed by a correction into the 2022 lows as wave II.
Copper (HG) Monthly Elliott Wave Chart
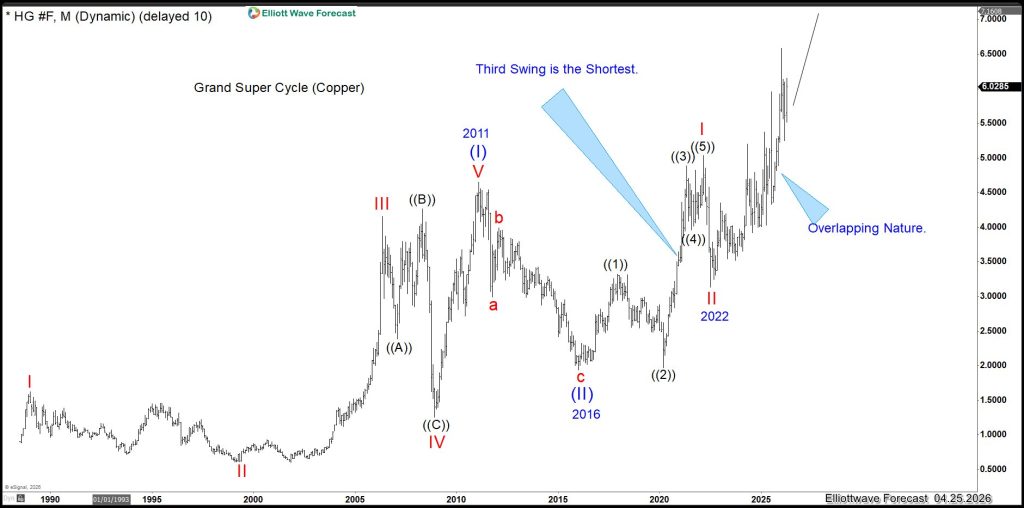
Since then, price action has developed into a highly overlapping structure. By nature, this could initially be interpreted as either a wave ((V)) or the beginning of a new impulsive sequence. However, applying Elliott Wave rules more strictly provides clarity.
One key observation is that the cycle from 2016 is the shortest among the three primary cycles. As a result, the current structure—being longer and more complex than the 2016 cycle—cannot be labeled as a wave ((V)). Instead, it strongly suggests a nesting structure (a series of first and second waves), which typically precedes powerful impulsive moves.
This has important implications. Nesting structures at higher degrees often lead to explosive market behavior as multiple wave degrees align. In this context, Copper is signaling that the broader risk market may be preparing for a significant advance in the months and years ahead.
While some instruments may appear confusing or contradictory in the short term, Elliott Wave Theory—when applied through its core rules—provides a consistent directional bias. From this perspective, Copper (“Dr. Copper”) is pointing toward higher prices and, by extension, continued strength in risk assets.
The conclusion is straightforward: the right side remains to the upside. Rather than reacting to headlines or short-term noise, we focus on structure, rules, and price behavior. We trade what the market is doing—not the story built around it.
Copper is showing the path, and risk assets are likely to follow.
Source: https://elliottwave-forecast.com/stock-market/hg_f-cooper-dr-cooper-is-calling-risk-on/