
In trading, there are moments that validate not just a strategy—but an entire framework of understanding market behavior. The recent movement in the S&P 500 is one of those moments.
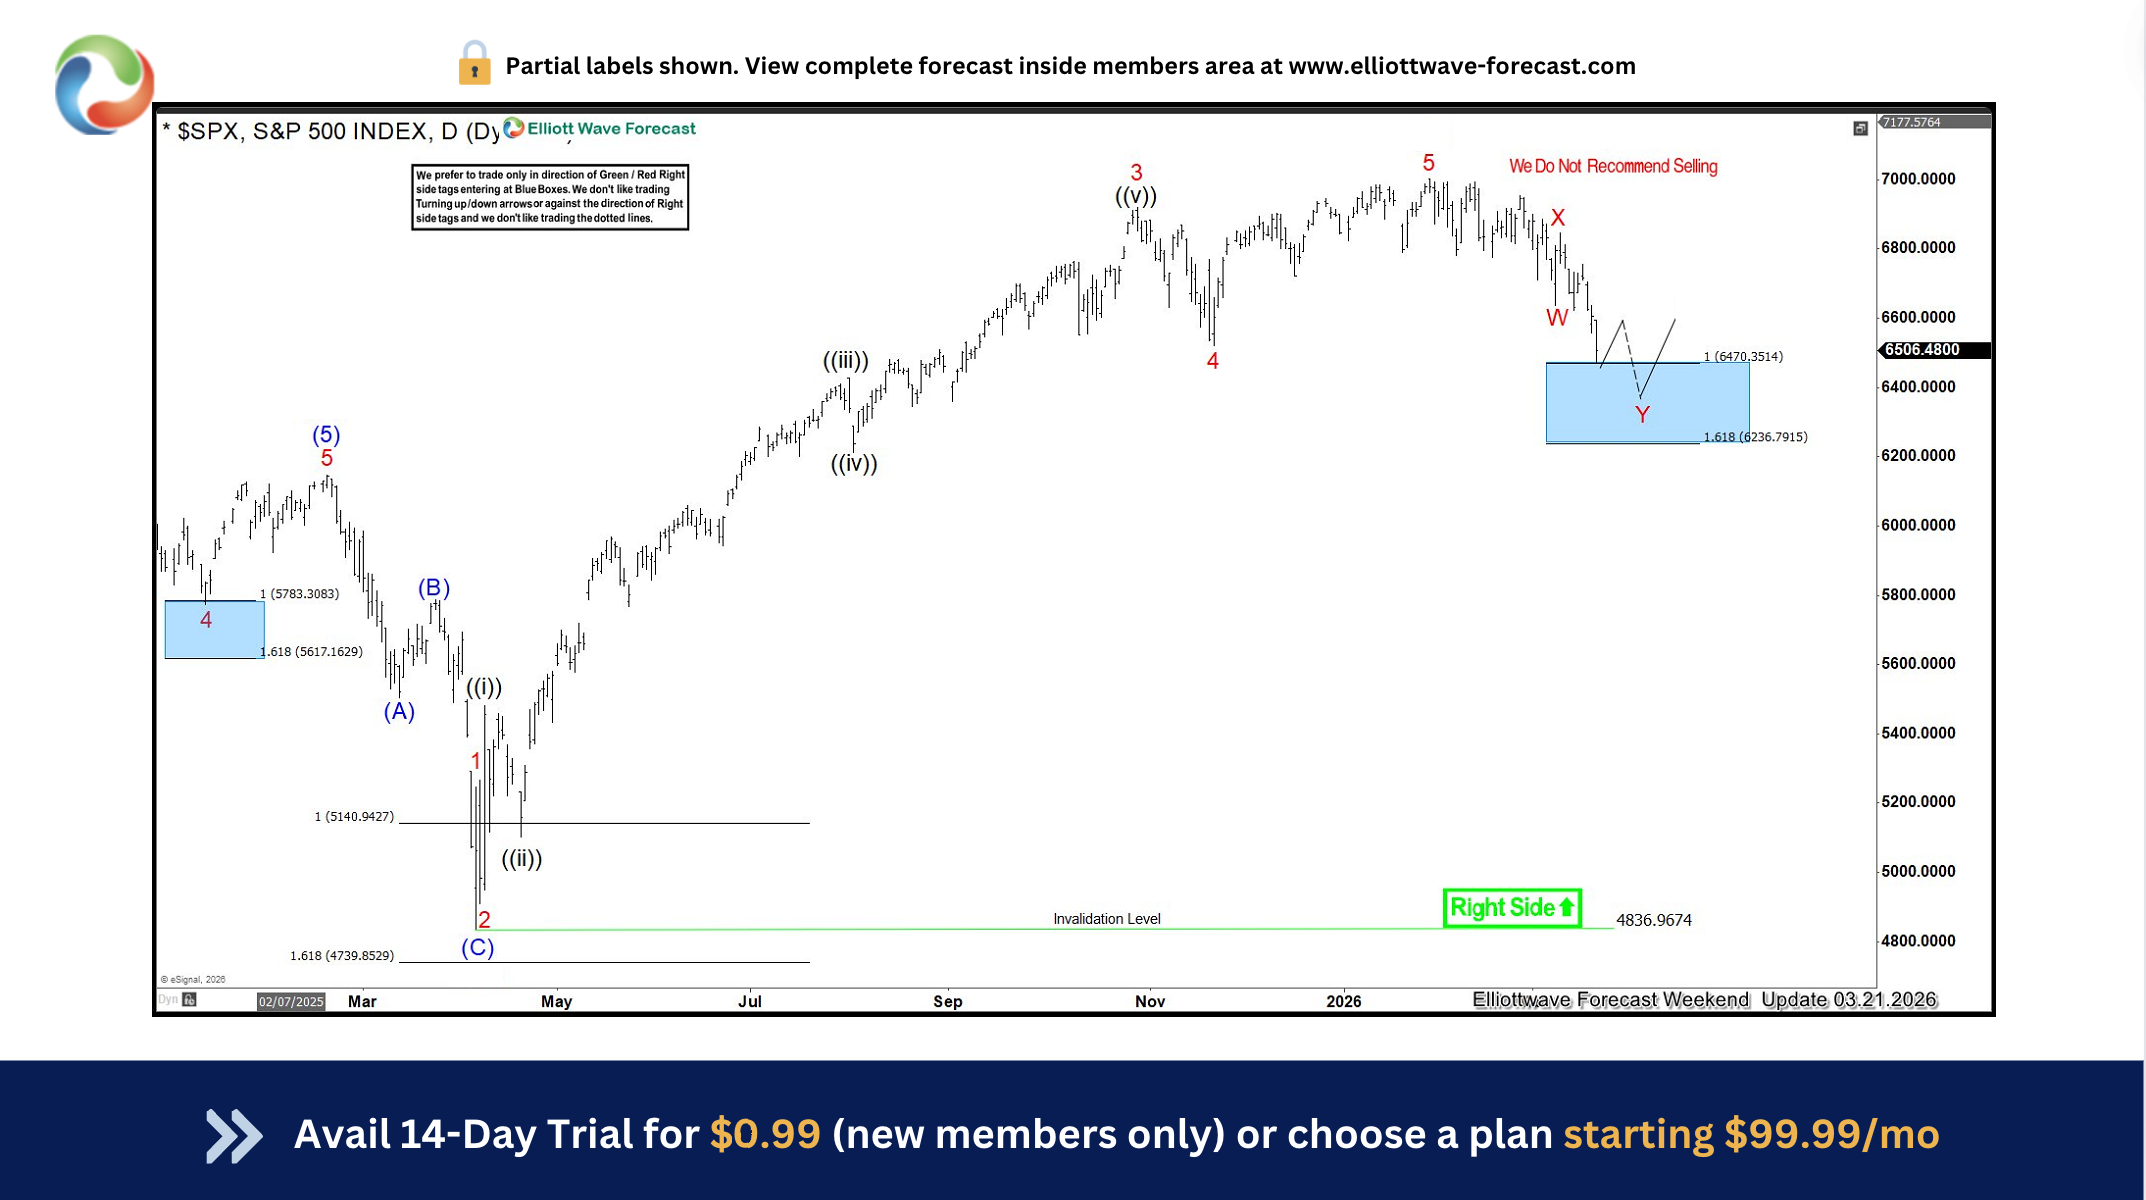
Weeks ago, we outlined a projection that the market would decline into a predefined Blue Box area 6470.3514 – 6236.7915 a high‑probability support area identified through measured extensions and corrective structures during our live session. This was not a random forecast, but the result of a disciplined application of Elliott Wave analysis, specifically the unfolding WXY structure since January 28, 2026, combined with Fibonacci relationships and historical price behavior
The forecast
Our outlook anticipated a corrective move unfolding after the completion of a larger impulsive sequence. As price action developed, the structure pointed clearly toward a downside continuation into a key support region—the Blue Box.
This zone represented:
- A confluence of Fibonacci extension levels
- The completion area of a corrective wave sequence (W–X–Y structure)
- A region where selling pressure was expected to exhaust
Rather than chasing price or reacting emotionally to volatility, the strategy was simple: wait for the market to come to us.
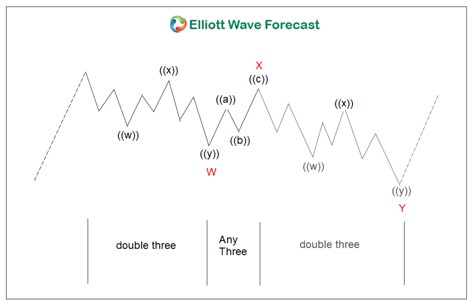
What Is The W-X-Y Structure ?
The W‑X‑Y structure is a sideways corrective pattern formed by combining two distinct corrections. Most traders are familiar with individual corrective patterns such as Zigzags, Flat corrections, and Triangles. When two of these patterns are linked together, the result is a double three—commonly labeled W‑X‑Y. Example below image
The Reaction
The market reacted exactly as projected. Price declined into the Blue Box with precision, touching the predefined support zone. As anticipated, buyers emerged, selling pressure eased, and a reversal began to take shape
This is where preparation meets opportunity.
Instead of uncertainty, there was clarity:
- The zone had been defined in advance
- Risk could be managed effectively
- The reaction confirmed the underlying bullish structure
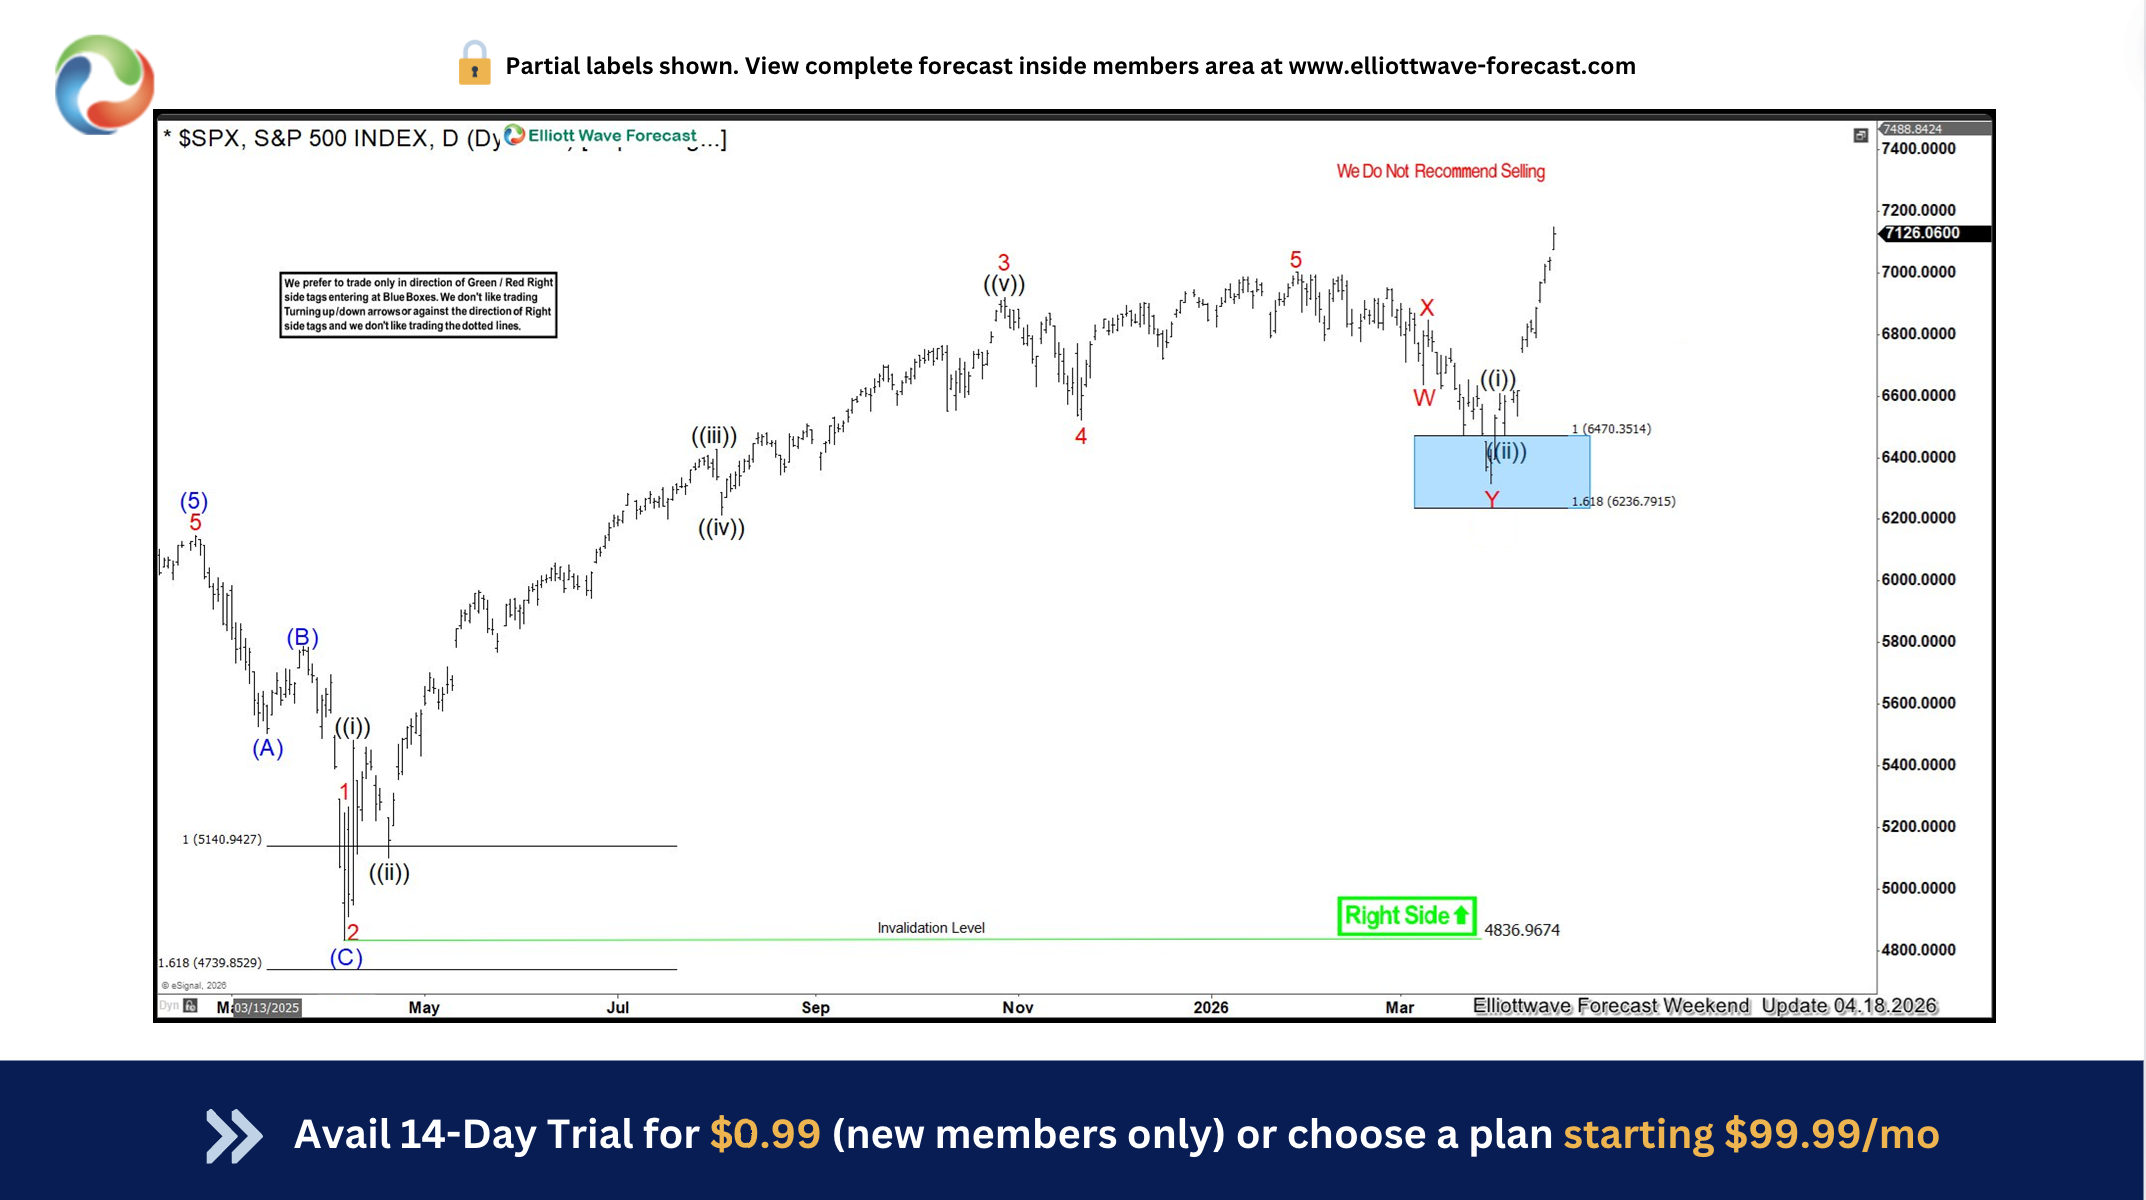
Following the test of the Blue Box, the market wasted no time—it rallied decisively. This move underscores a key principle: markets follow structure, not chaos. By aligning with patterns, traders shift from reacting to anticipating. The rally indicates that the correction has likely run its course, with the broader trend still intact. While short‑term fluctuations remain possible, the larger outlook now leans bullish after this successful support reaction. As long as price holds above the March 2026 corrective lows, failure should occur in either 3 or 7 swings, and focus will turn toward identifying the next buying opportunities
What This Means for Traders
This example highlights a few critical lessons:
- Patience Pays
Waiting for price to reach high-probability zones reduces guesswork and improves consistency. - Structure Over Emotion
Forecasting based on structure allows traders to stay objective—even during volatile moves. - Precision Matters
The accuracy of the Blue Box reaction shows the importance of defining clear entry zones rather than chasing the market.
Final Thoughts
The market respected the forecast—trading into the Blue Box, finding support, and delivering the expected reaction. This isn’t about predicting every tick; it’s about identifying high‑probability scenarios and executing with discipline. The focus remains on following structure, managing risk, and letting price confirm the next move. The question now isn’t whether the Blue Box worked—it’s how you position yourself for the next opportunity.
At Elliottwave Forecast (EWF), we deliver consistent market updates through regular charts update. Our analysts update 1‑hour charts four times daily and 4‑hour charts once per day across all 78 instruments. In addition, we host five live sessions each day and maintain a 24‑hour chatroom, providing clients with real‑time market guidance and answers to any questions they may have.