
Newmont Mining (NEM), the world’s largest gold producer, remains a pivotal asset in the resource sector and a key proxy for broader precious metals trends. Its price action has consistently reflected both macroeconomic cycles and investor sentiment toward gold, while its Elliott Wave structure highlights the potential for sustained bullish momentum.
Newmont Monthly Elliott Wave Chart
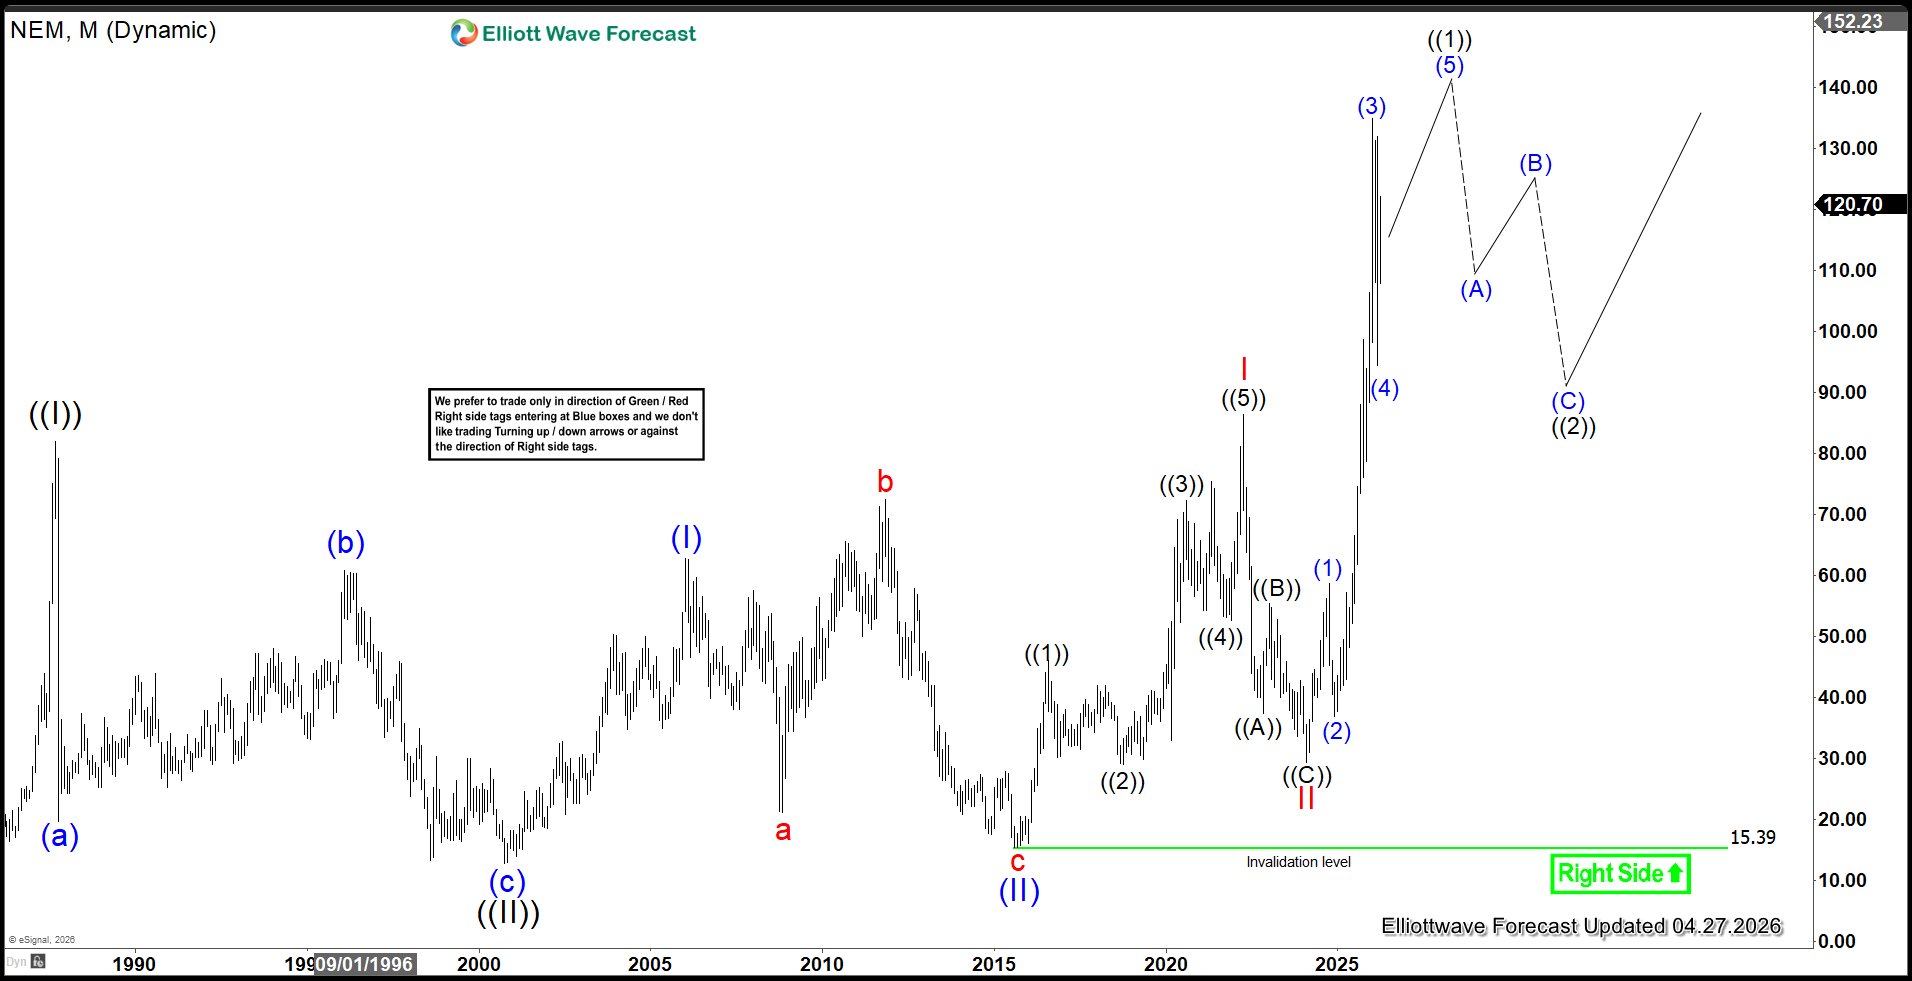
Newmont Mining (NEM) continues to demonstrate a robust bullish trajectory, underscored by its monthly Elliott Wave structure. The chart signals an impending breakout that could propel the stock toward fresh record highs. Historically, NEM completed wave ((II)) of the Grand Super Cycle in September 2000 at $12.75. From that base, wave (I) advanced to $62.72 before wave (II) corrected sharply to $15.39. The ongoing wave (III) is unfolding as a nested impulse, with wave I reaching $86.37 and wave II retracing to $29.42. As long as the price action remains above the critical $15.39 level, the broader bullish structure stays intact, reinforcing expectations of sustained upside momentum in the periods ahead.
Newmont Daily Elliott Wave Chart
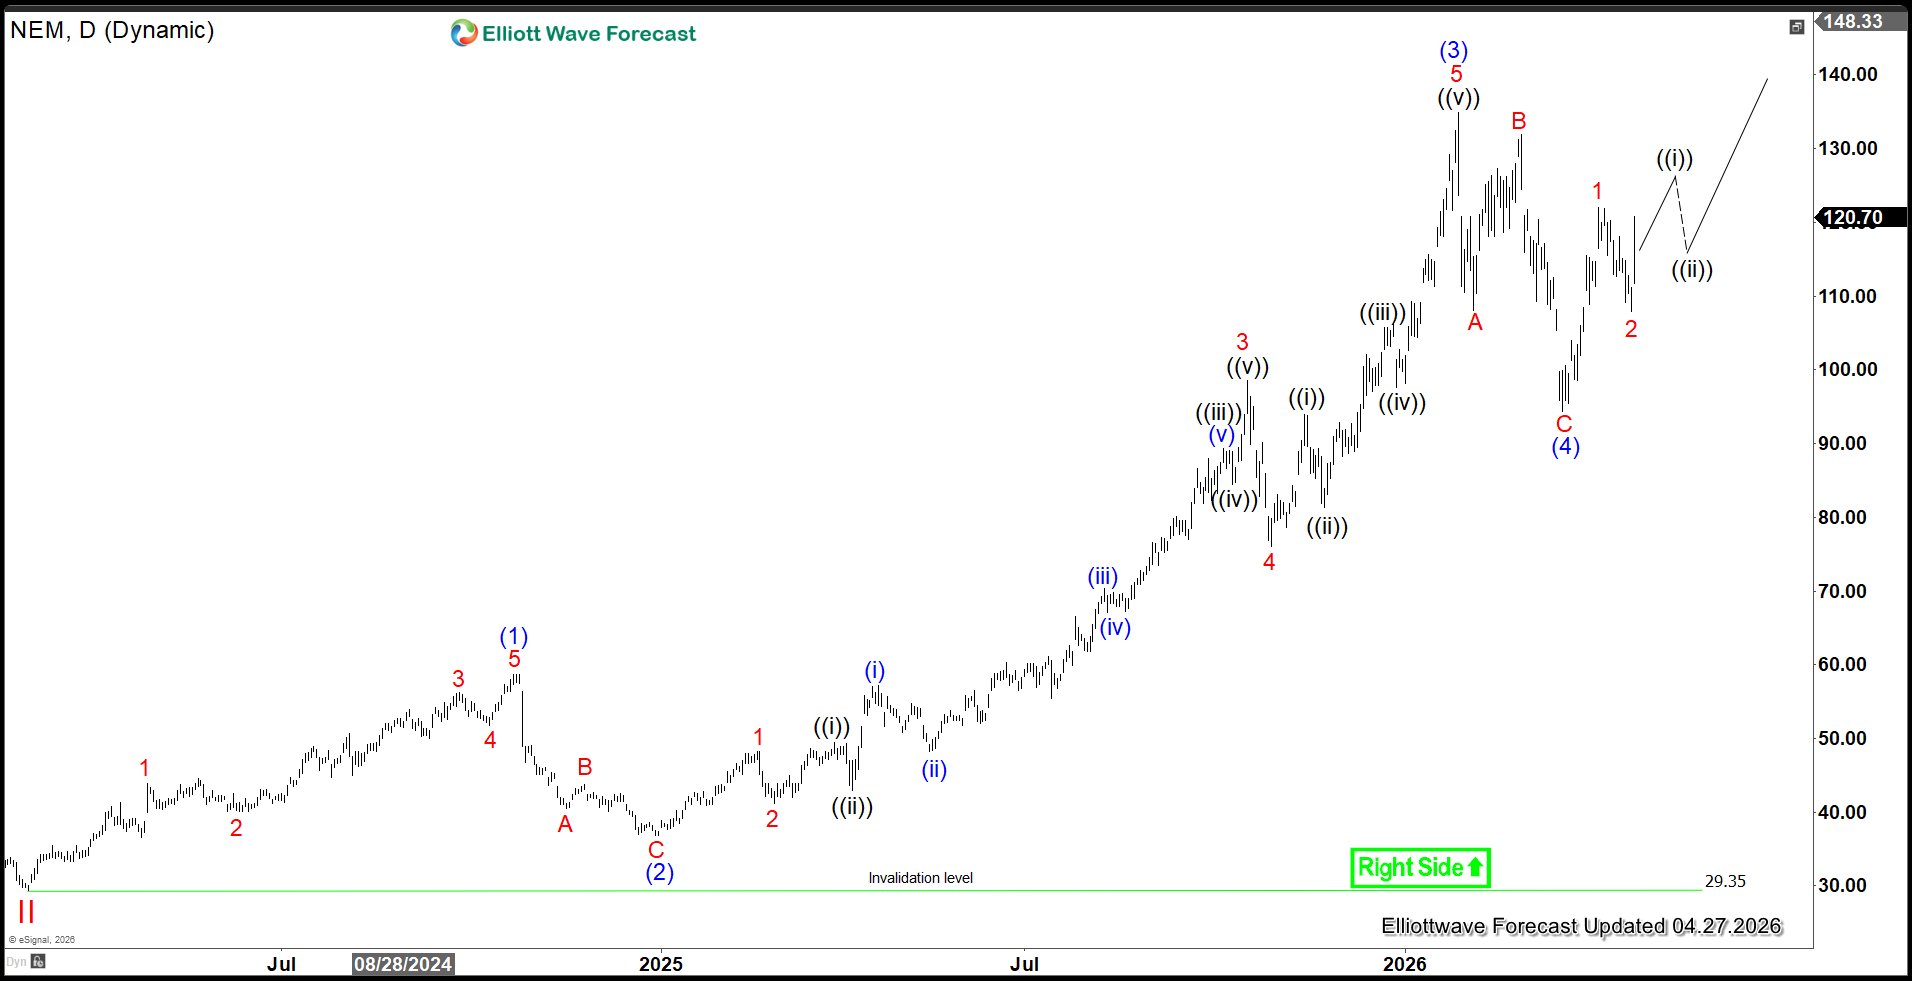
The daily Elliott Wave analysis of Newmont Mining (NEM) underscores a well‑defined impulsive structure. Following the completion of the wave II correction at $29.03, the stock transitioned into wave III,. From that low, wave (1) advanced to $58.72 before wave (2) retraced to $36.86. Subsequently, wave (3) extended sharply to $134.88, while the corrective wave (4) concluded at $94.34. Although a break below $94.34 could imply a double correction, this scenario appears less probable given the impulsive nature of the rally from wave (4). As long as the critical $29.03 support level holds, NEM maintains strong potential to continue its advance within the broader wave III structure.