
Hello fellow traders. In this technical article we’re going to look at the Elliott Wave charts of EURUSD forex pair published in members area of the website. The pair has recently given us Double Three pull back and found buyers again precisely at the equal legs area as we expected. In the following text, we’ll explain the Elliott Wave count.
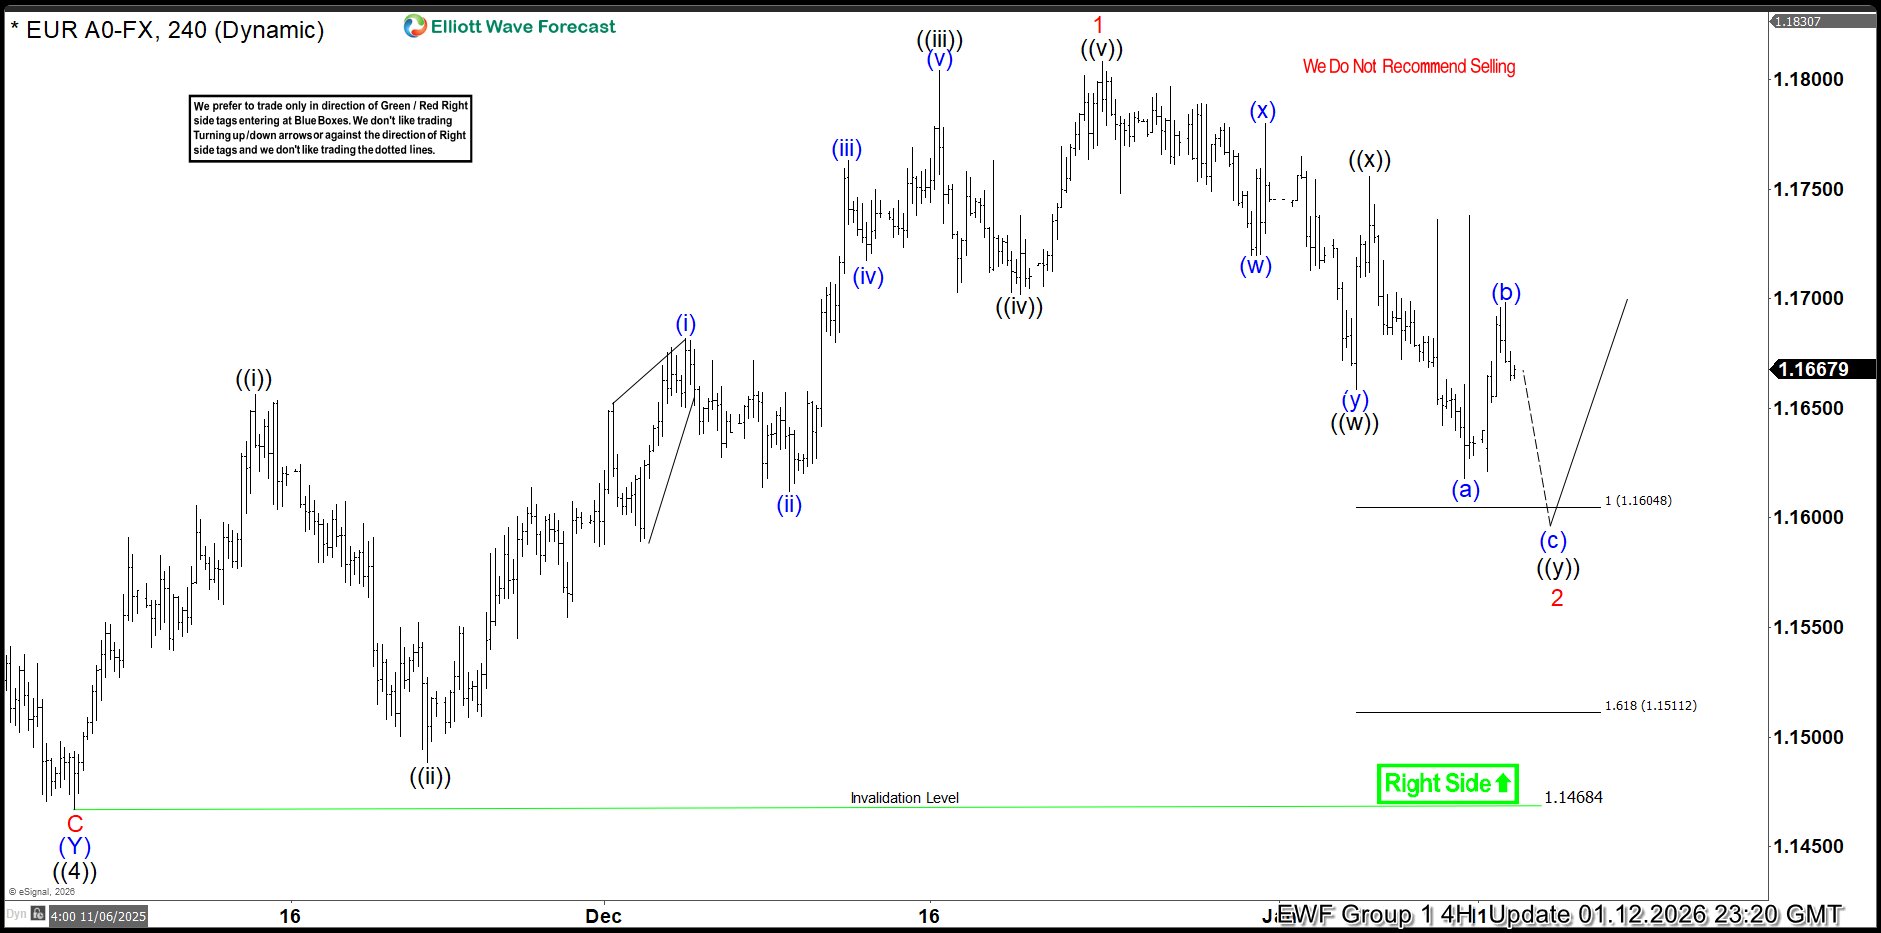
EURUSD Elliott Wave 4 Hour Chart 01.12.2026
EURUSD is currently forming an intraday three-wave pullback from recent highs. We identified a buying zone by measuring the Equal Legs area using the Fibonacci extension tool, with ((w)) projected relative to ((x)). The ideal support area comes in at 1.16048–1.15112. The correction is not complete yet, and the pair could see more downside in the near term toward the marked buying zone. As long as price holds within this region, we expect buyers to step in and the rally to resume toward new highs.
You can learn more about Elliott Wave Patterns at our Free Elliott Wave Educational Web Page
90% of traders fail because they don’t understand market patterns. Are you in the top 10%? Test yourself with this advanced Elliott Wave Test
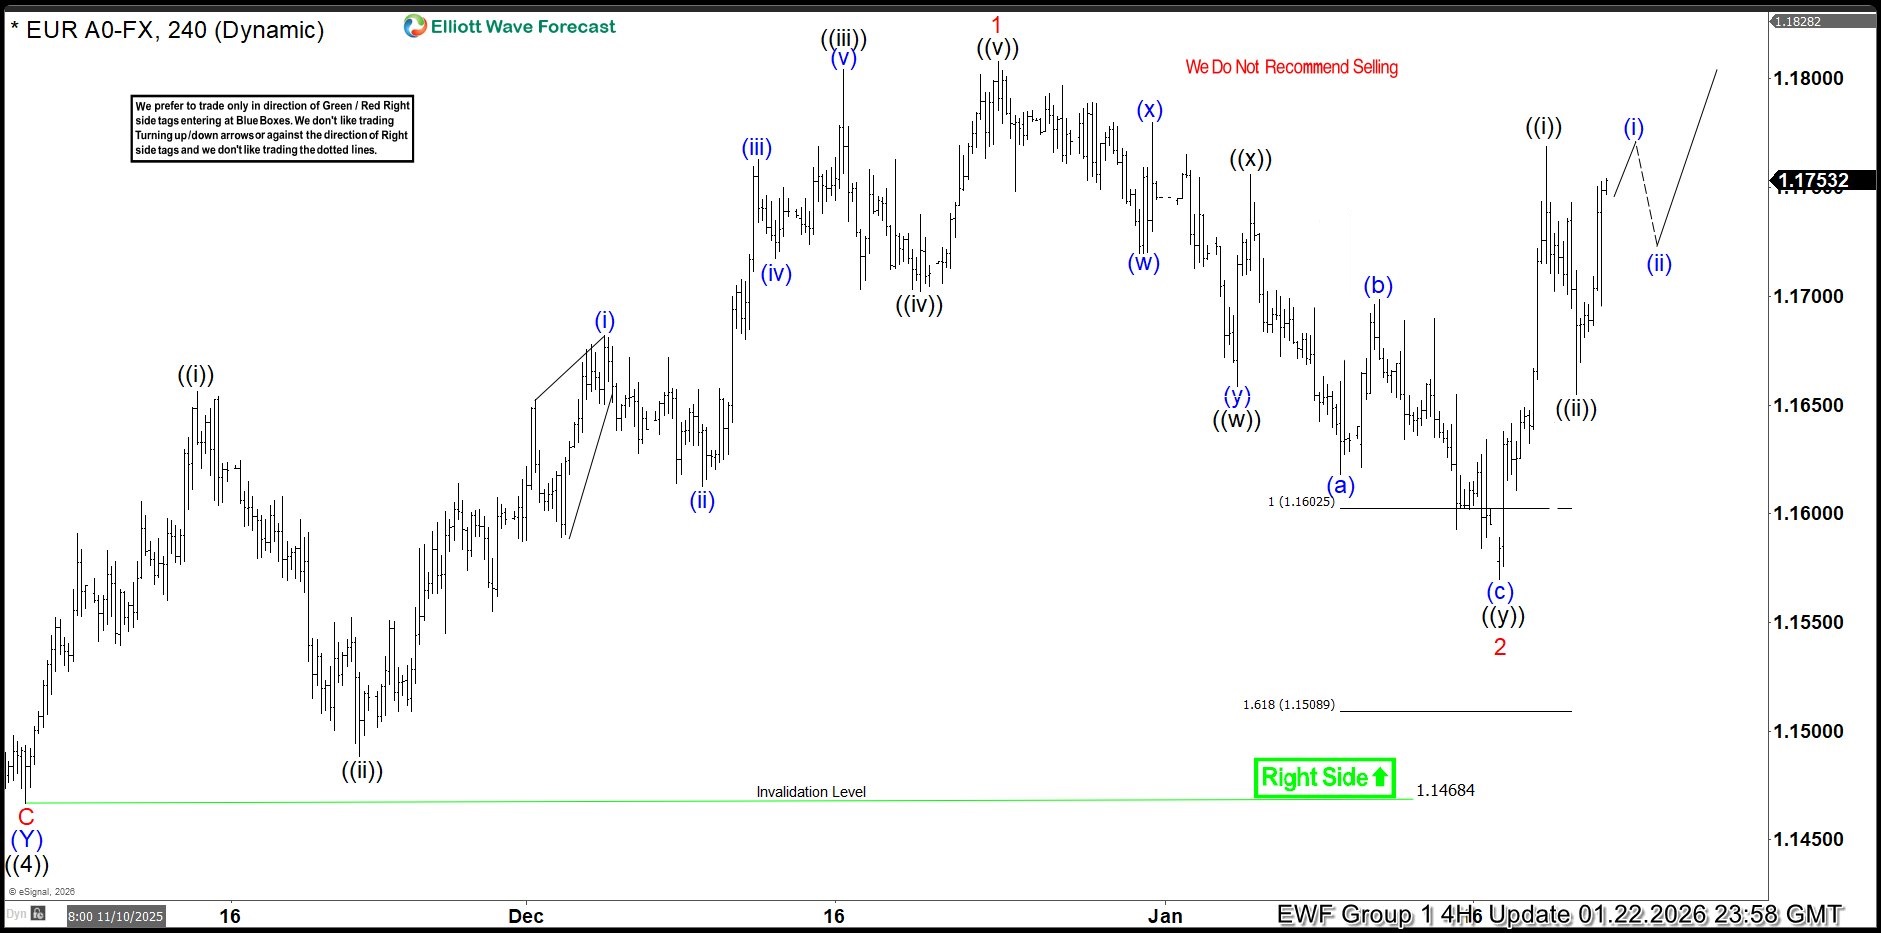
EURUSD Elliott Wave 4 Hour Chart 01.12.2026
The pair has found buyers at the Equal Legs zone , just as expected. The correction ended at the 1.15709 low, and since then, EURUSD is giving us a rally. As a result, any long positions from the equal legs zone are now risk-free.
Reminder for members: Our chat rooms in the membership area are available 24 hours a day, providing expert insights on market trends and Elliott Wave analysis. Don’t hesitate to reach out with any questions about the market, Elliott Wave patterns, or technical analysis. We’re here to help.
Source: https://elliottwave-forecast.com/forex/eurusd-elliott-wave-rally-double-three/