Hello everyone! In today’s article, we’ll examine the recent performance of Alphabet Inc. ($GOOGL) through the lens of Elliott Wave Theory. We’ll review how the powerful rally from the October 2025 low unfolded as a textbook 5-wave impulse and discuss our evolving forecast for the next move. Let’s dive into the fascinating structure and expectations for this tech giant.
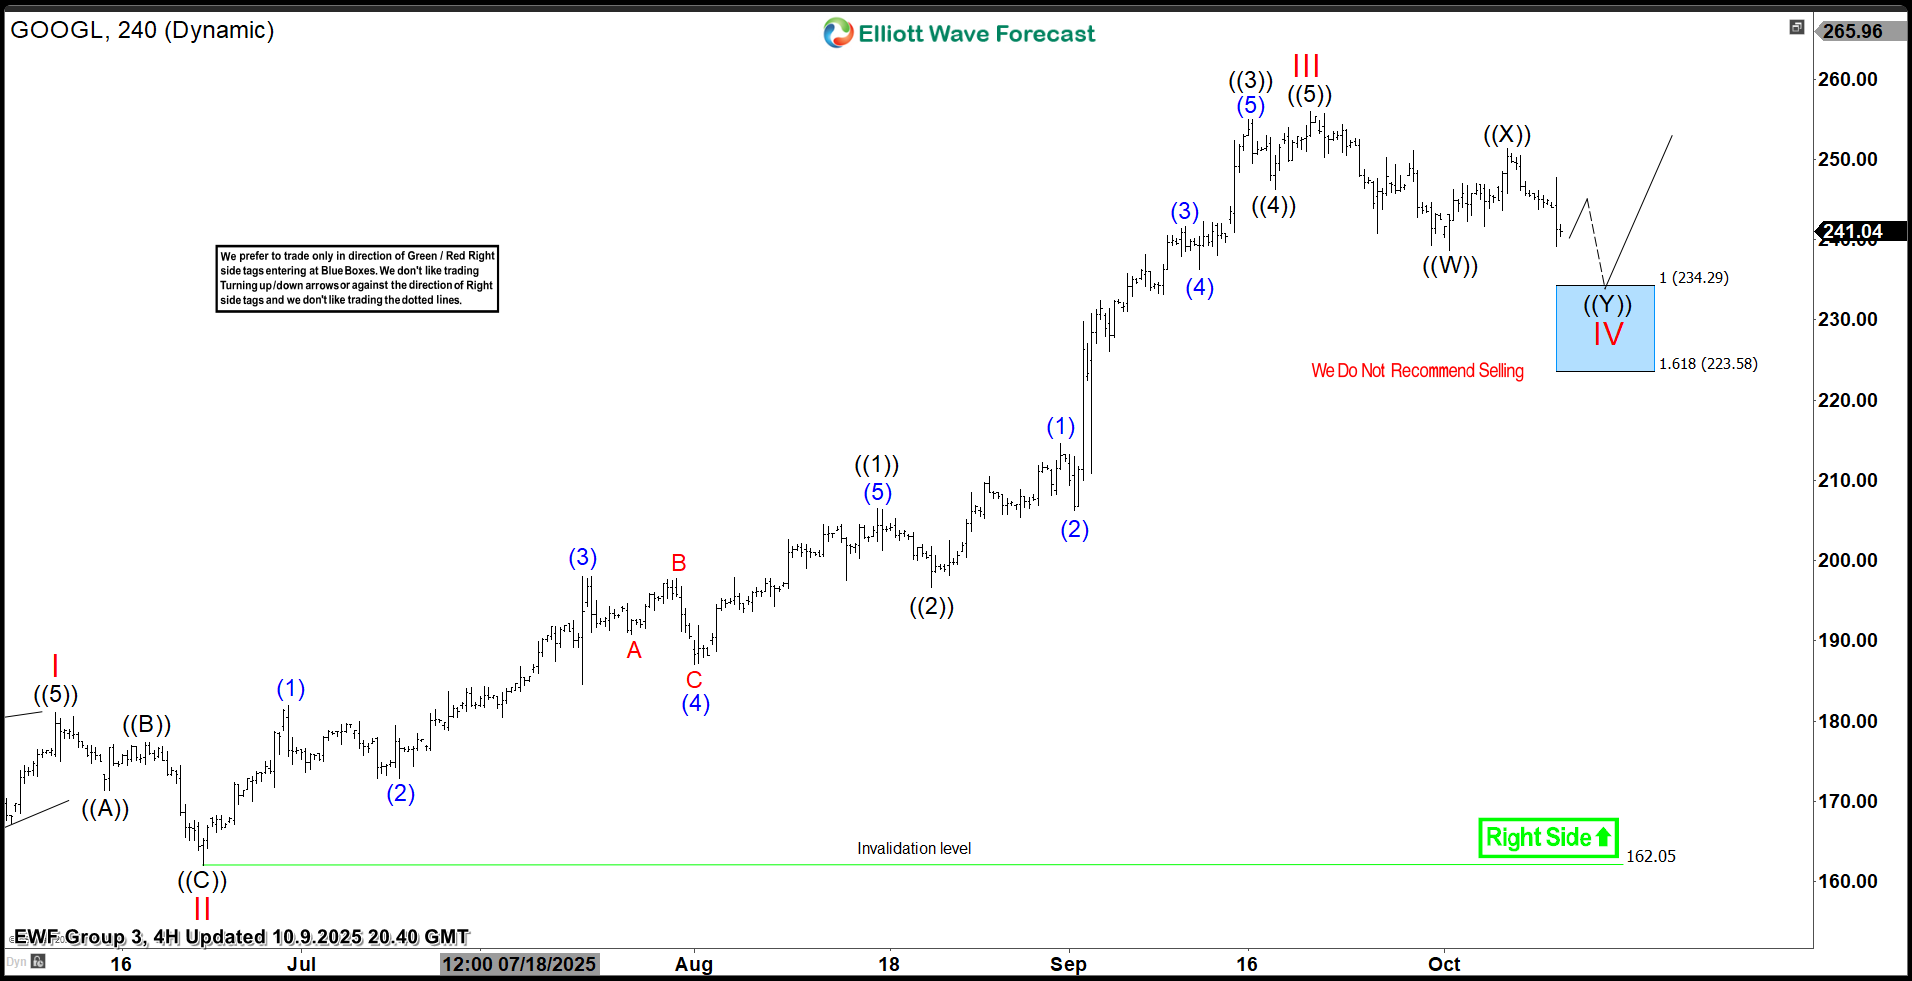
5 Wave Impulse + 7 Swing WXY correction
$GOOGL 4H Elliott Wave Chart 10.09.2025:

$GOOGL 4H Elliott Wave Chart 11.24.2025:
Fast forward two months to our latest update, and the charts tell a compelling story. $GOOGL bounced right from that “blue box.” This wasn’t a small bounce. It was a huge rally, up about 40%! The stock hit new all-time highs.
Right now, the stock is still climbing. It is in what we call wave (3) of wave ((5)). This means more gains are likely. We think $GOOGL could reach $340–$347 next. After that, we might see another pullback.
Conclusion
In conclusion, our Elliott Wave analysis of $GOOGL continues to prove accurate, suggesting that the stock remains well-supported against its April 2025 lows. For traders who capitalized on the entry opportunities presented in the “blue box” area, the $340–$347 zone should be closely monitored as the next significant objective. In the interim, keeping a vigilant eye out for any healthy corrective pullbacks could present fresh entry opportunities for those looking to join the trend.
By applying the principles of Elliott Wave Theory, traders can gain a deeper understanding of market cycles, better anticipate the structure of upcoming moves, and ultimately enhance their risk management strategies in dynamic markets like the current one for $GOOGL.

