Hello traders. Welcome to another blog post where we discuss trade setups shared with Elliottwave_Forecast members. In this one, the spotlight will be on Natural Gas.
On the weekly chart, Natural Gas completed the third wave of a long-term bearish cycle in March 2024, forming an impulse wave that started in August 2022. As a result, from the March 2024 low, a new long-term bullish cycle began. This cycle could last for several years and may push prices well above the $10 mark. However, while an impulse sequence is expected from March 2024, traders and investors should anticipate at least a three-wave bounce. The first sub-wave — an impulse structure — started at the March 2024 low and completed at the 2025 peak.
According to Elliott Wave Theory, a three-wave correction usually follows a five-wave advance. That’s exactly what is happening now. The pullback from the March 2025 top appears corrective and should end above the March 2024 low. Therefore, our focus over the past few months has been on this corrective cycle from March 2025.
From our weekly and daily chart updates, we identified a double zigzag corrective pattern unfolding from the March 2025 high. Wave (W) ended in April 2025, and wave (X) ended in June 2025. Thus, we expect wave (Y) to extend toward 2.10–1.619 to complete the entire bearish cycle.
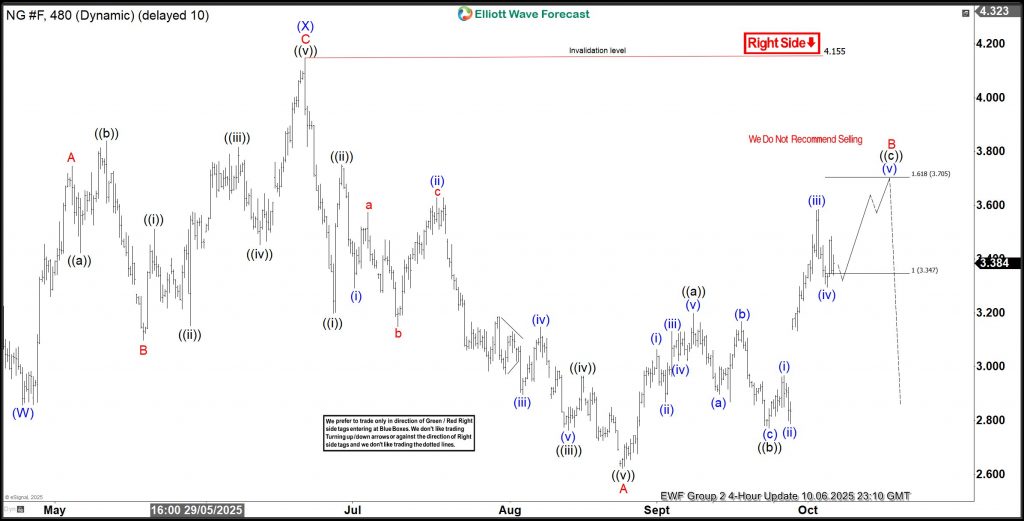
Wave A of (Y) ended with a five-wave structure below the April 2025 low (wave (W) low). Then, a corrective bounce followed. When that bounce began, we explained in the live trading room why we preferred to sell at the extreme for wave B of (Y). Once the bounce matured, we shared the H4 chart update on October 6, 2025.
Natural Gas Trade Setup – 10-06-2025
On 6th October, 2025, we shared the chart above. Wave B emerged higher as a simple 3-wave zigzag structure. We identify the extreme zone at 3.347-3.705 to members. In the live trading room and daily technical videos, we recommended to members to go short for a short term counter-trend trade (remember, NG is in a corrective phase).
Natural Gas Trade Setup – 10-16-2025
On October 16, 2025, we shared the chart above with members, showing a bearish reaction from the marked extreme zone. At that point, a five-wave decline was developing and nearing completion. Members in the live trading room had already taken partial profits at the first target and moved the rest of the position to breakeven. This step ensures a risk-free trade in case a strong bounce follows, as corrective markets can sometimes appear complete before extending further.
Source: https://elliottwave-forecast.com/commodities/natural-gas-sellers-booked-profits/


