
The VanEck Semiconductor ETF (SMH) gives investors access to 25 major U.S.-listed semiconductor companies. The fund includes NVIDIA, Taiwan Semiconductor, Broadcom, Texas Instruments, QUALCOMM, ASML Holding, Applied Materials, Lam Research, Micron Technology, and AMD.
Analysts view SMH as a strong investment in a sector driving advancements in AI, cloud computing, and high-performance computing. While volatile, experts emphasize long-term growth, supported by rising demand for AI, 5G, and autonomous vehicles. Despite market fluctuations, SMH often outperforms when investor sentiment improves.
Investors closely monitor global supply chains, trade policies, and new chip innovations, which could shape future growth. With these factors influencing the market, SMH remains an attractive option for exposure to the semiconductor industry.
Last SMH Daily Chart January 16th

Earlier this year, on January 16, 2025, we analyzed the VanEck Semiconductor ETF (SMH) and observed its sideways movement between $230 and $260 in the daily timeframe. As expected, the market rallied from $222.20, but momentum failed to break previous highs or reach the $269.50 level. Consequently, we adjusted our chart and identified Wave I as a leading diagonal that ended at $262.26. Since October 2024, the price traded within a Wave II correction, which we classified as a running flat correction.
At that time, we believed Wave III had already started, with Wave ((1)) of III topping at $257.20 before entering a Wave ((2)) pullback. As long as price action held above $240.62, we expected a bullish move targeting a break above $283.07.
However, while we favored the running flat correction scenario for Wave II, we acknowledged the possibility of an expanded flat correction. If the market had fallen below $240.62, SMH would have likely extended its decline toward the $235.29 – $228.61 range before completing Wave II and resuming its upward trend.
SMH Daily Chart May 13th
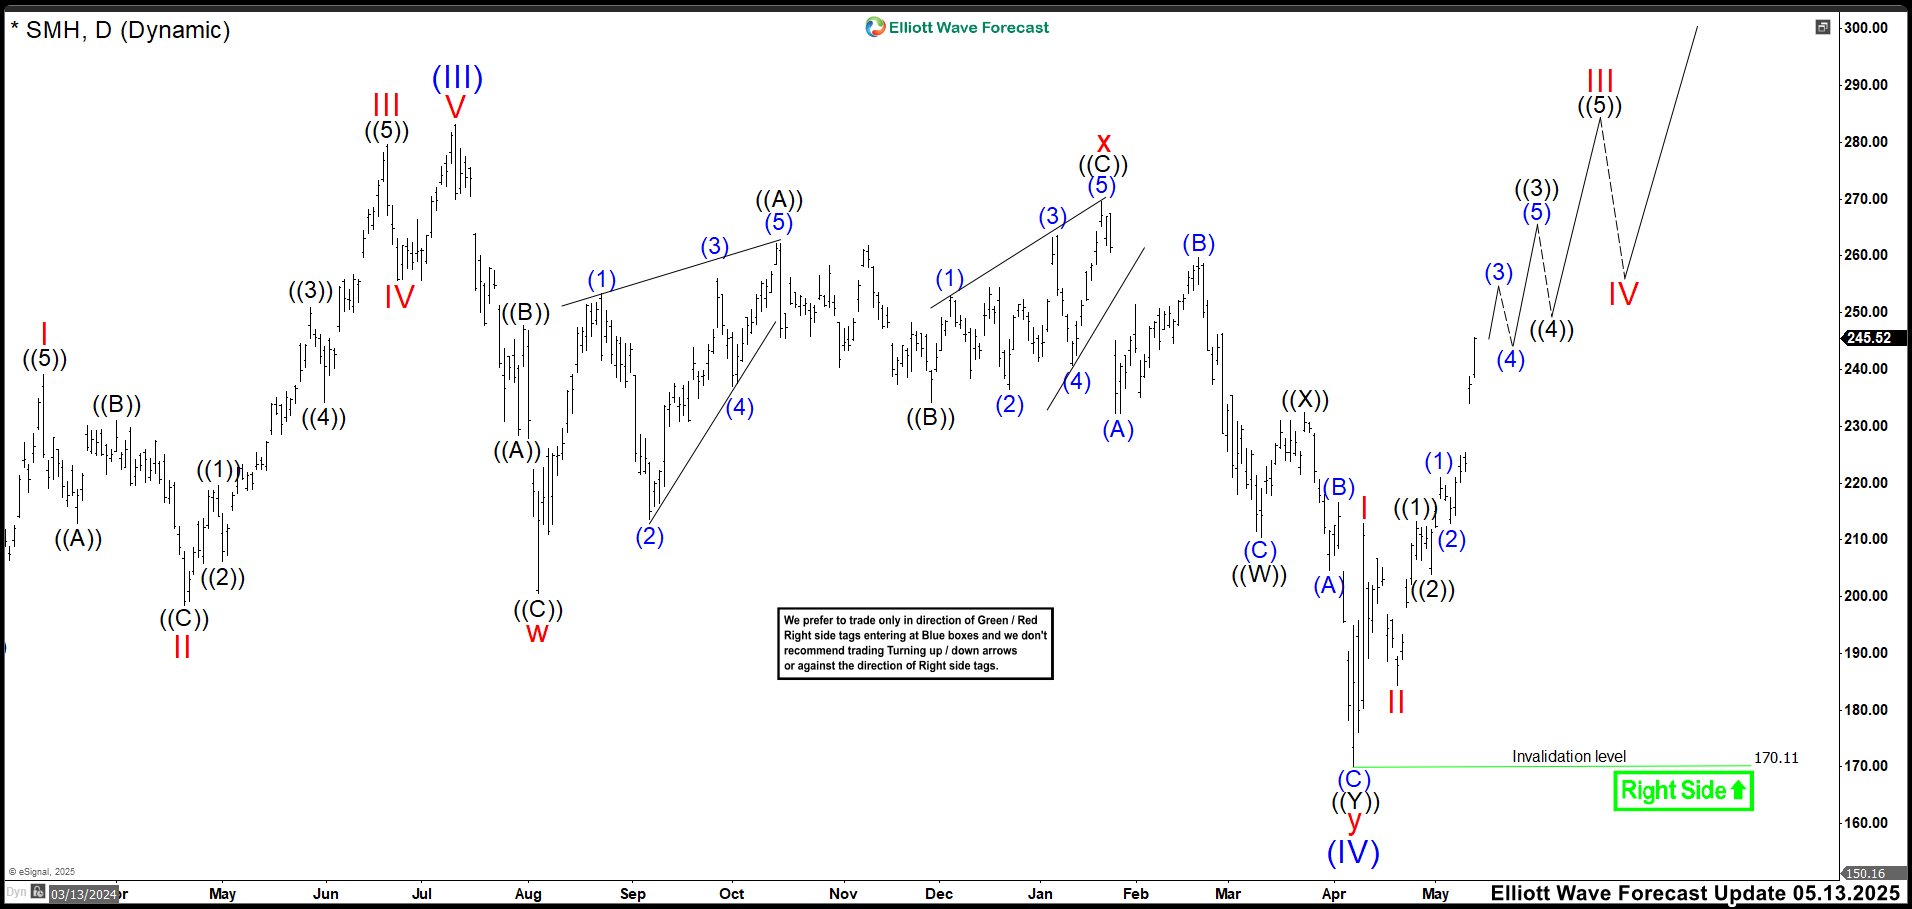
In our latest update, we observed that the zigzag correction (a, b, c) failed, leading to a double correction (w, x, y). This aligns with the fundamental concept that corrections move in 3, 7, or 11 swings, forming a simple correction, a double correction, or a triple correction. As analysts, we must assess which of these three scenarios is most likely to occur.
When wave (C) of ((W)) broke below wave (A), it served as an early signal that a double correction might unfold. This was later confirmed when the August 2024 low was breached. From the wave (III) high, the first leg of the double correction formed as a zigzag, ending wave w at 200.49. Following that, another zigzag pattern developed, featuring two diagonals’ structures one leading and one ending which marked the completion of wave x at 269.66. Finally, the double correction in wave y wrapped up at 170.11, completing wave (IV) within the Fibonacci extension zone of 186.80 – 167.22 (100% – 123%).
Current Outlook & Strategy
At present, it is clear that SMH is developing an impulse from the 170.11 low. The primary expectation is for the upward movement to persist, supported by corrections in 3, 7, or 11 swings. Given this setup, the best strategy is to buy the dips, as the bullish trend remains intact.
Looking ahead, we are targeting the 309.83 – 353.03 zone as a potential area for wave (V) to complete. Once SMH reaches this range, a more significant correction in the market could follow.
Be good and Trade Smart!
Source: https://elliottwave-forecast.com/stock-market/smh-finds-support-rally-motion/