Cameco Corporation (CCJ), headquartered in Saskatoon, is a leading uranium producer with significant global mining operations. As a key player in the nuclear energy sector, its performance is closely linked to uranium prices and regulatory developments. Below is a clear and accessible Elliott Wave technical update for Cameco’s stock:
Cameco ($CCJ) Monthly Elliott Wave Chart
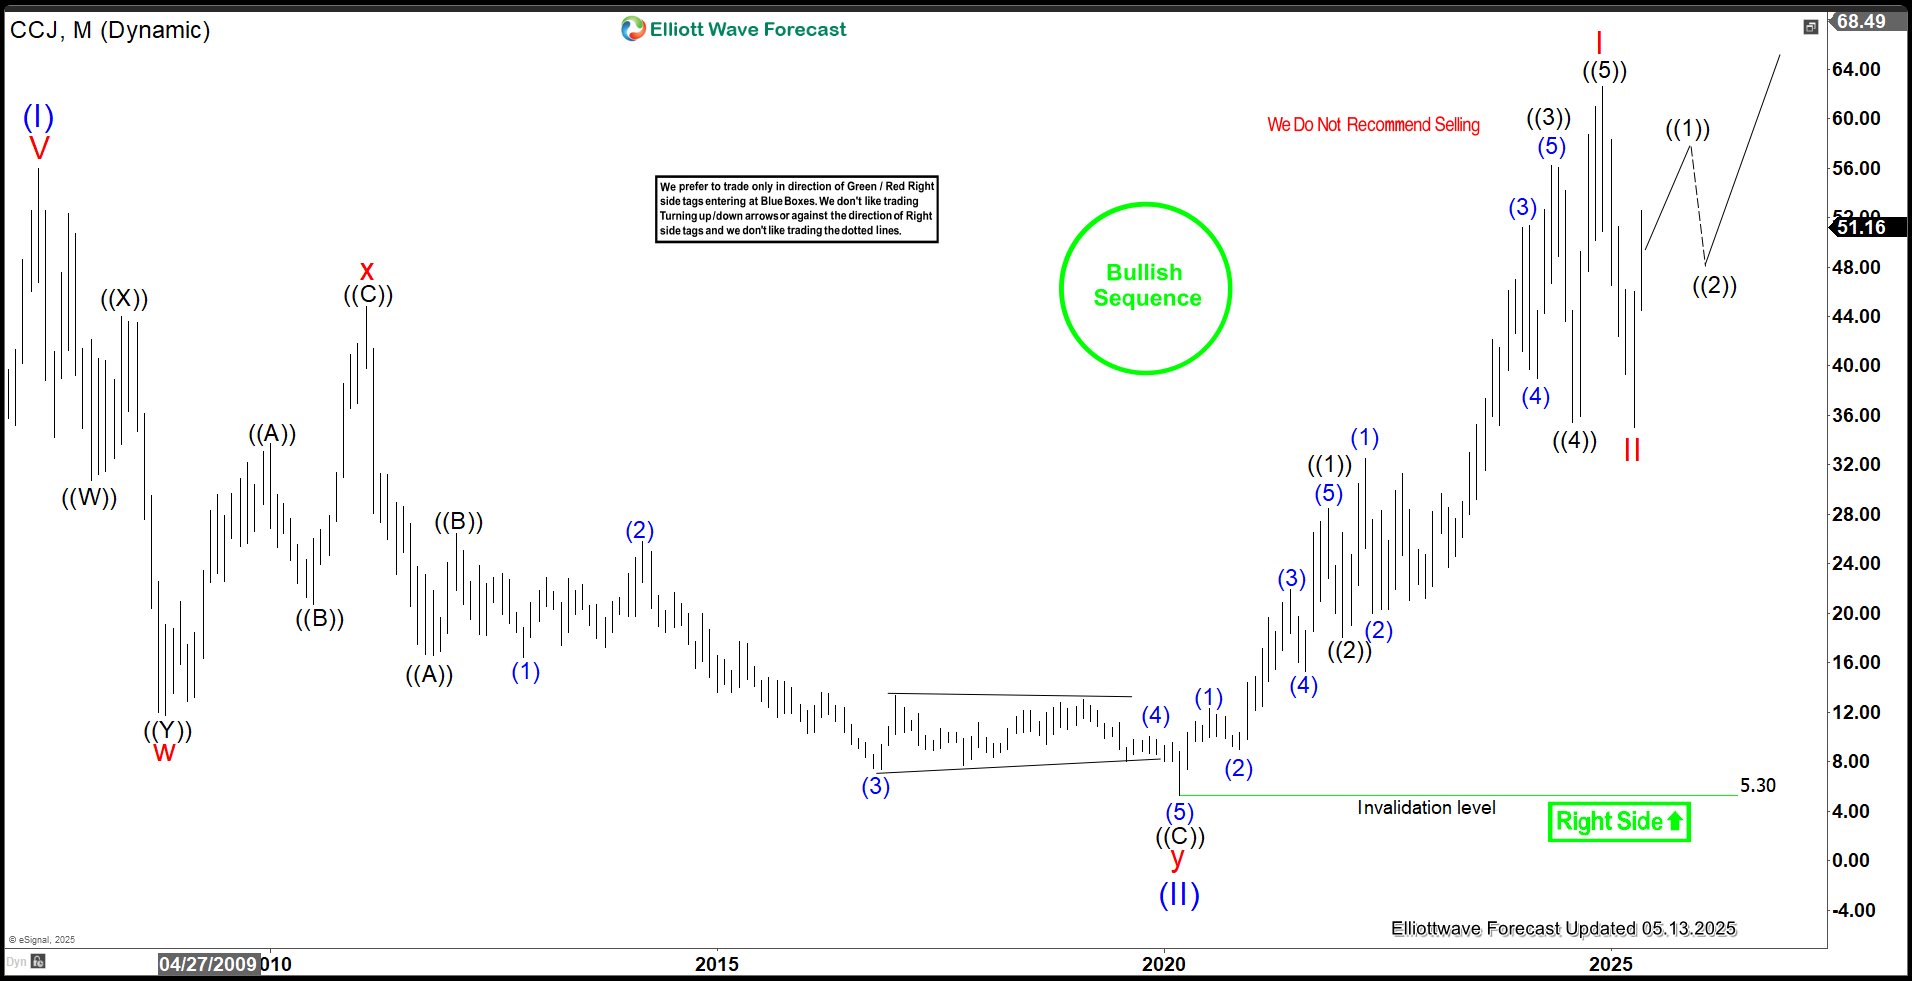
The monthly Elliott Wave chart for Cameco shows that the stock completed a significant long-term correction, labelled as wave (II), at a low of $5.30. From there, Cameco embarked on a new bullish cycle, poised for further gains in the years ahead. The stock is currently in wave (III), marked by a strong upward trend. Starting from the wave (II) low, wave ((1)) peaked at $28.49, followed by a pullback in wave ((2)) to $18.03. Wave ((3)) then climbed to $56.24, with a subsequent dip in wave ((4)) to $35.43. The final leg, wave ((5)), reached $62.55, completing wave I of a larger degree. A correction in wave II brought the price to $35. As long as the stock stays above $5.30, the outlook remains bullish, with expectations of continued upward momentum.
$CCJ Daily Elliott Wave Chart
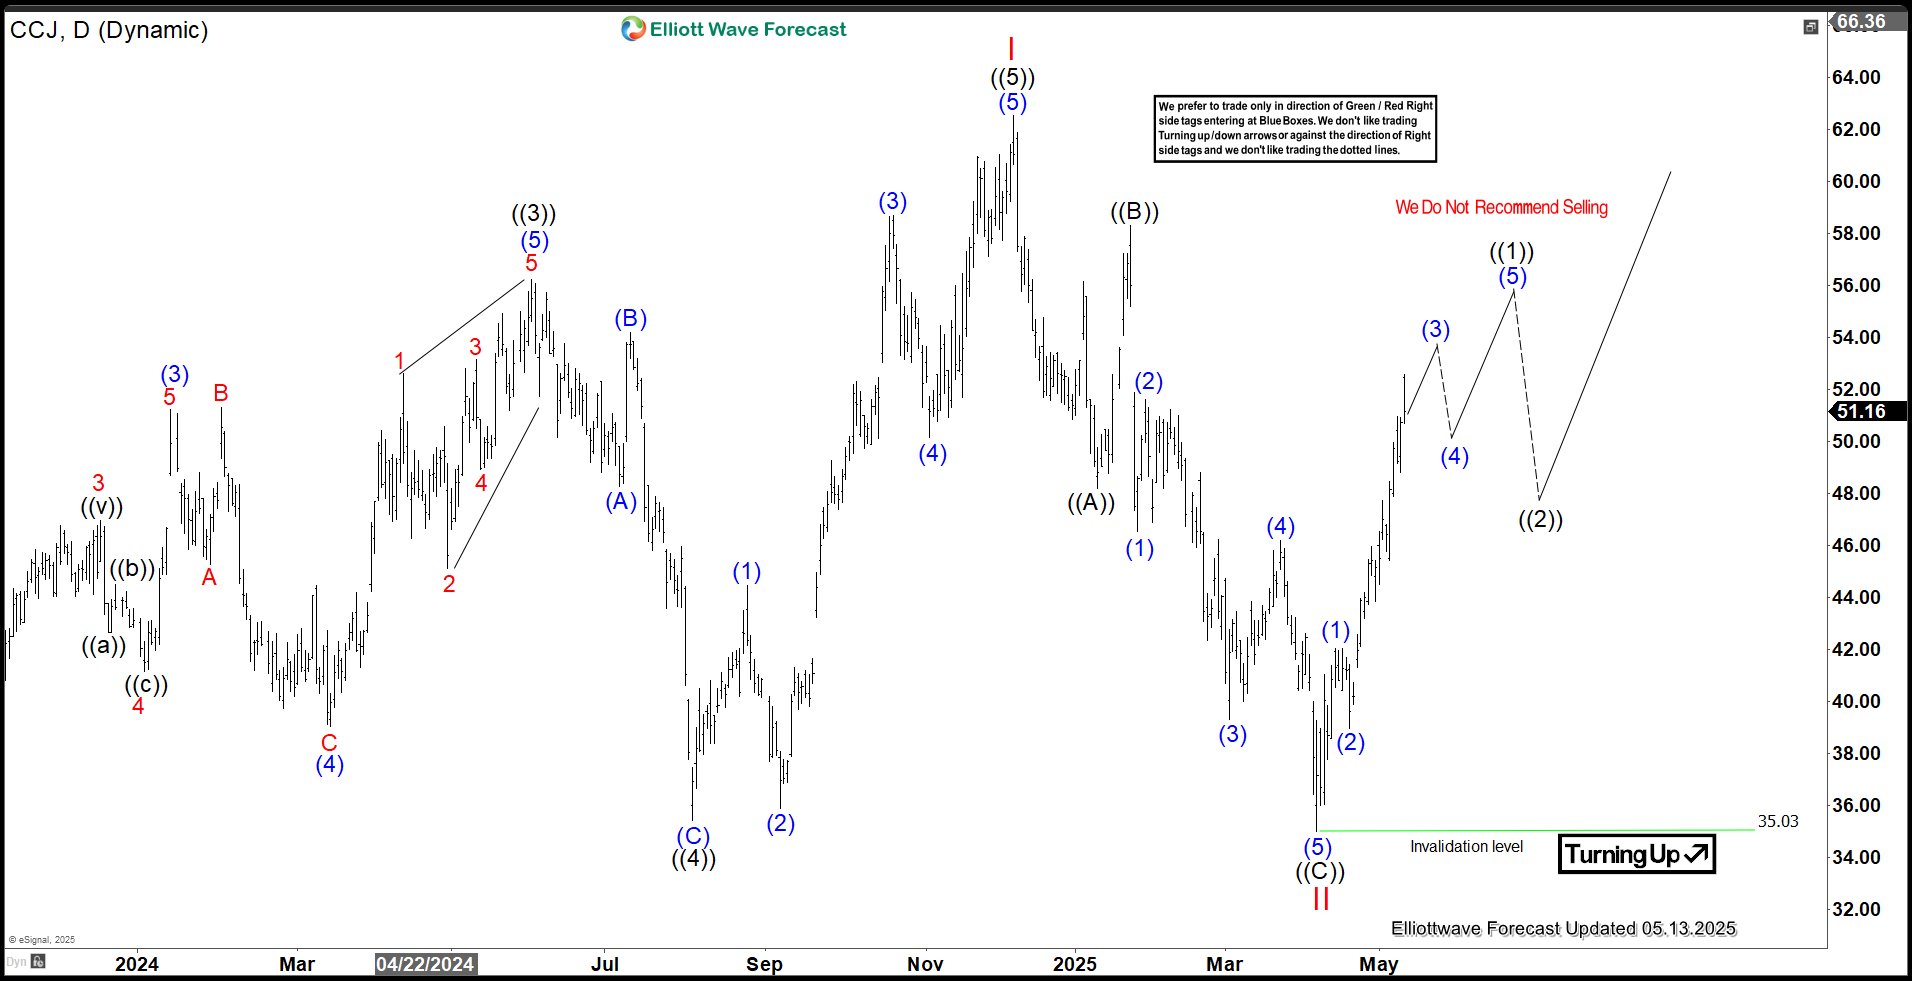
The daily Elliott Wave chart for Cameco (CCJ) indicates that the stock completed its wave I rally at a peak of $62.55, marking the end of an upward move that began at the March 2020 low. Following this, the stock experienced a notable pullback in wave II, which bottomed out at $35.03. Since then, Cameco has turned upward, rallying strongly from the $35.03 low in a manner that appears impulsive, suggesting potential for further gains. However, for the stock to confirm a sustained bullish trend and rule out a potential double correction, it must break above the wave I peak of $62.55.
Source: https://elliottwave-forecast.com/stock-market/cameco-ccj-ended-correction-resumed-higher/