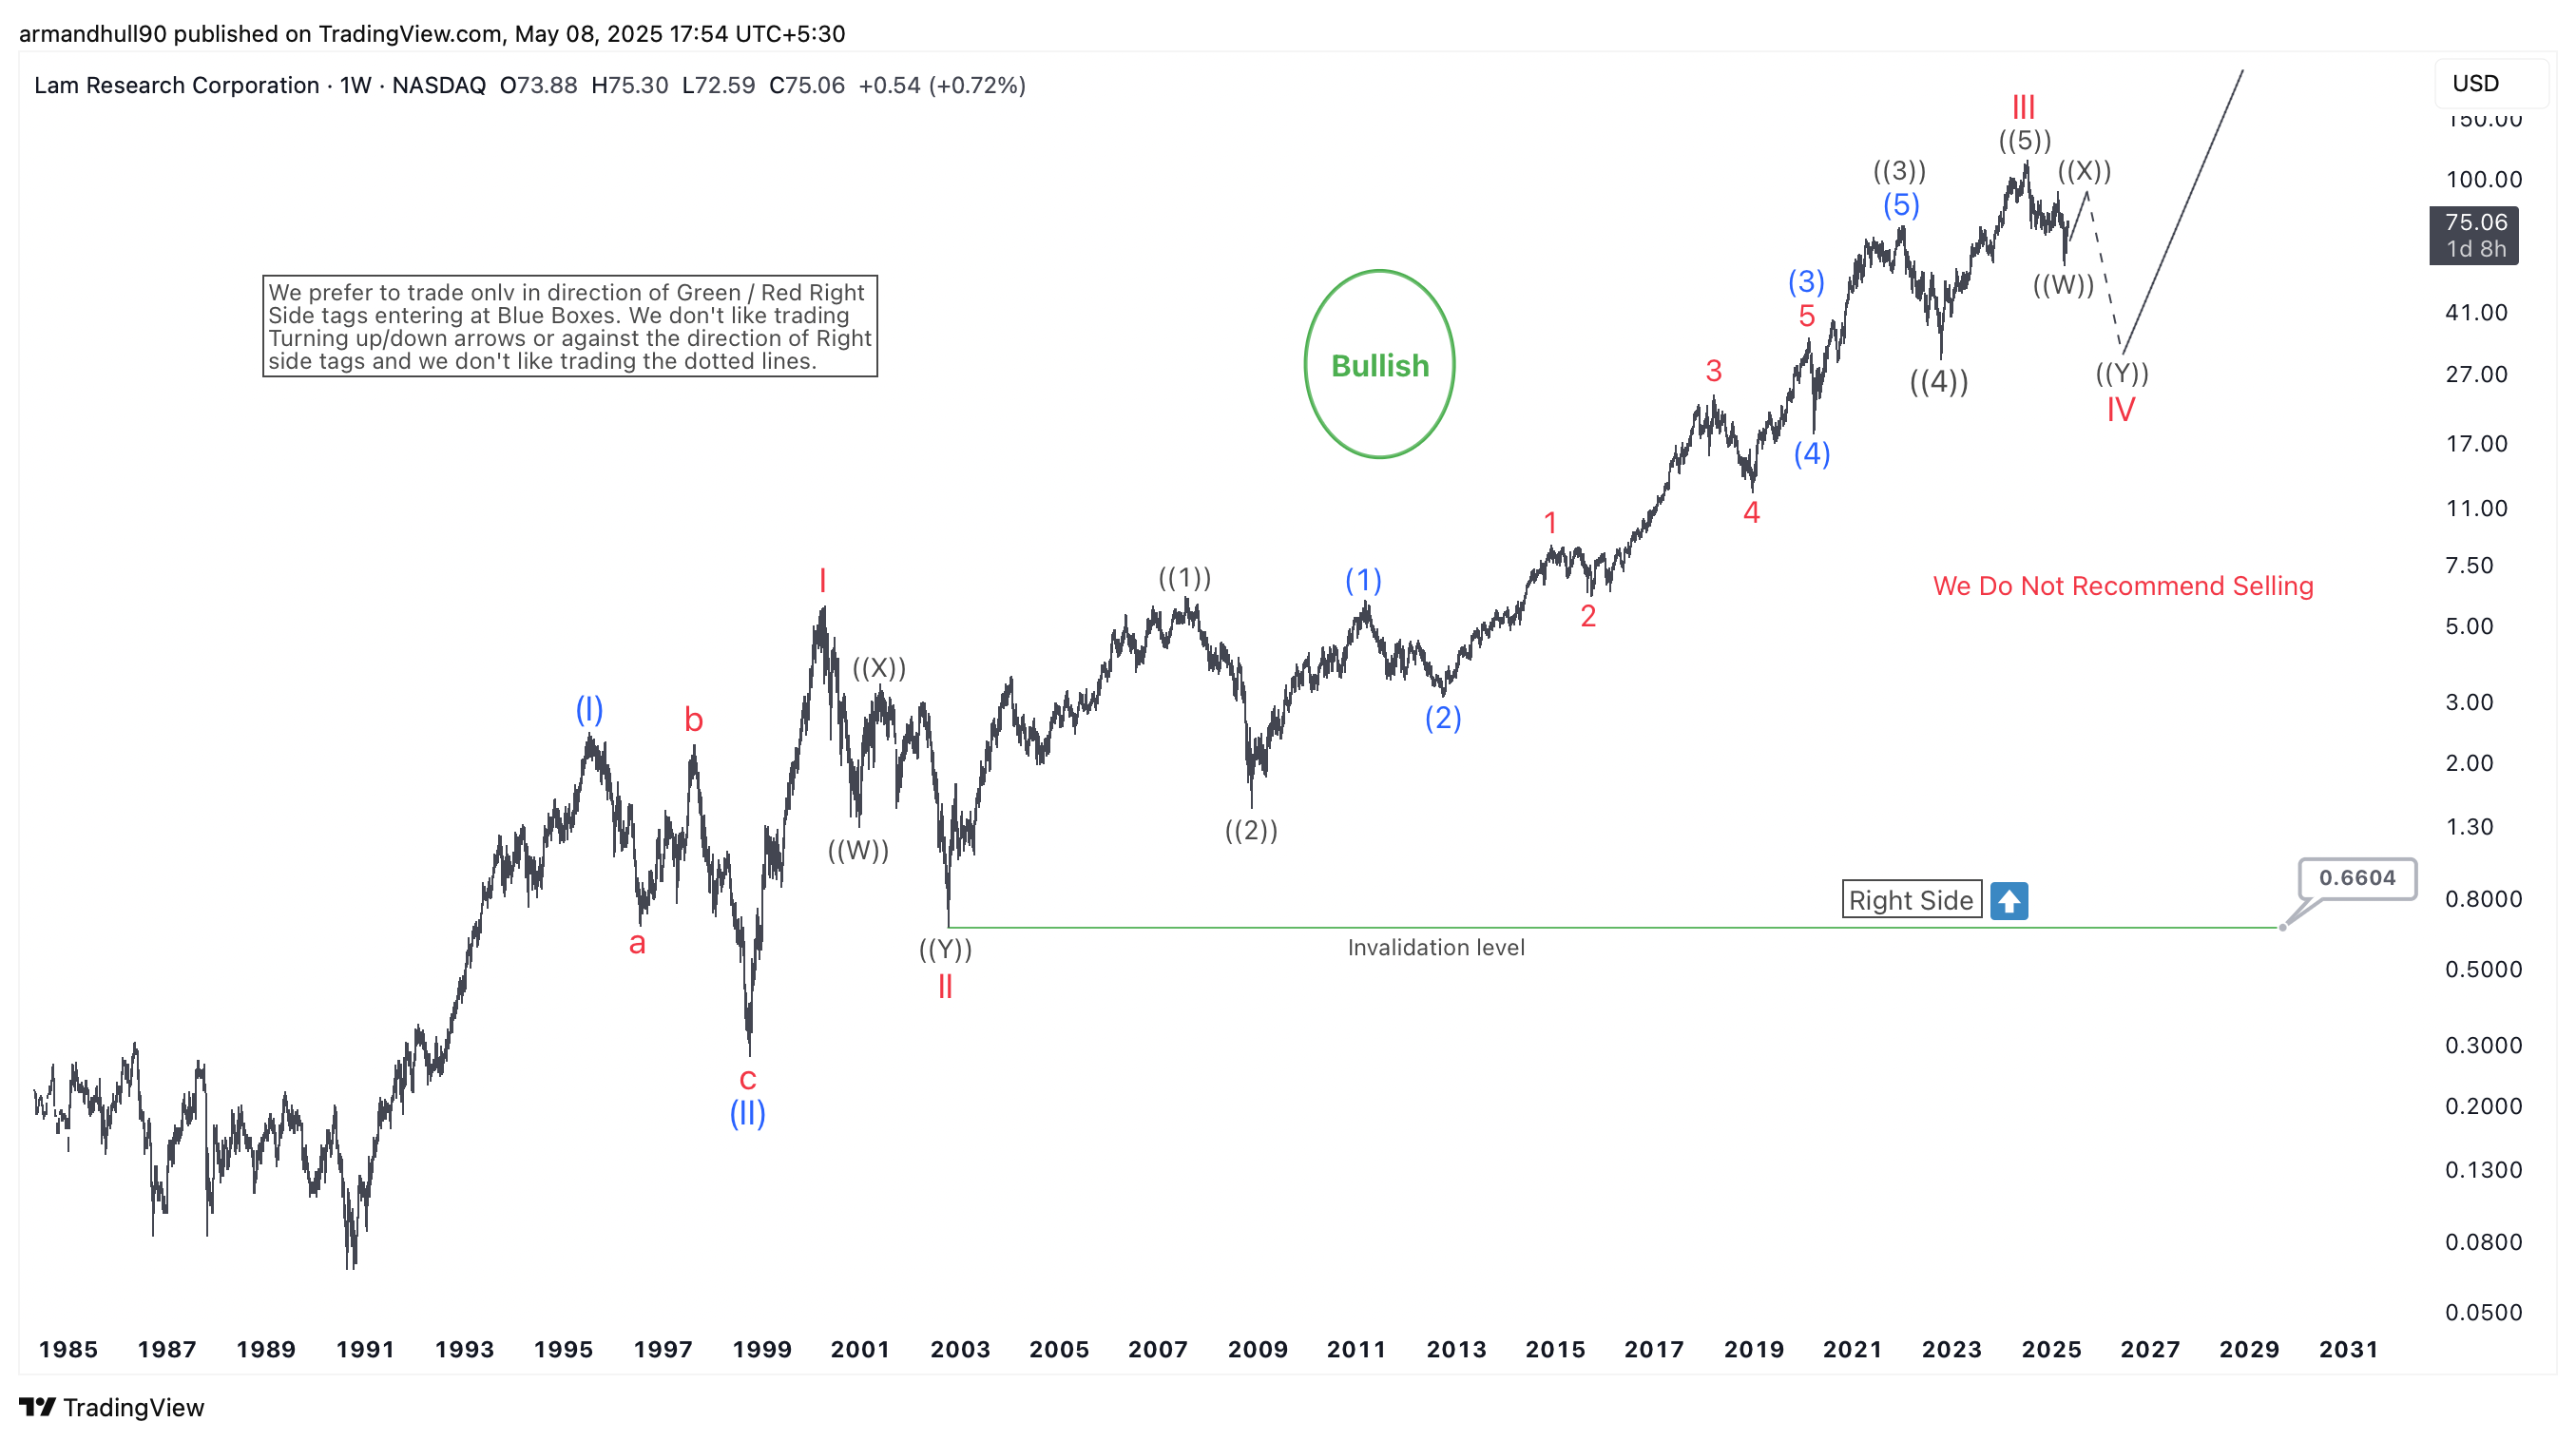
Lam Research (LRCX) remains bullish despite a corrective wave IV. Elliott Wave analysis suggests further upside potential as wave V approaches.
Lam Research Corporation (LRCX) shows a strong long-term bullish trend based on Elliott Wave analysis. The multi-decade chart highlights a clear impulsive structure that began in the early 2000s. After finishing a large corrective move, labeled as cycle wave II, the stock began a steady and powerful rally.
Wave III topped with a well-defined five-wave pattern from the 2009 low. The chart shows strong momentum and clean internal subdivisions, supporting the view of an extended bullish phase. Now, Lam Research is undergoing a correction in wave IV, which appears to form a double zigzag. The corrective sequence is labeled as ((W))-((X))-((Y)).

The key support lies at $0.6604. As long as the price stays above this level, the bullish view remains valid. The chart features a Right Side tag and a clear note: “We Do Not Recommend Selling.” This signals that the trend remains up and traders should not go against it. Pullbacks like the current one offer a chance to enter at better prices, not a reason to exit.
Wave IV is still in progress, but once it completes, wave V should begin. This final leg is expected to break into new all-time highs. While exact timing is uncertain, the setup continues to favor buyers over the long run.

